Build a Web App With Claude Code (No Hand-Coding)
Go from empty folder to a deployed live-data dashboard in nine prompts and zero hand-written code. The Claude Code build, with times and the bugs to expect.
>This covers your first build. Claude Code: Ship 12 Real Projects in 30 Days runs the same loop through production deploys, a Micro-SaaS with Stripe payments, and multi-agent workflows.
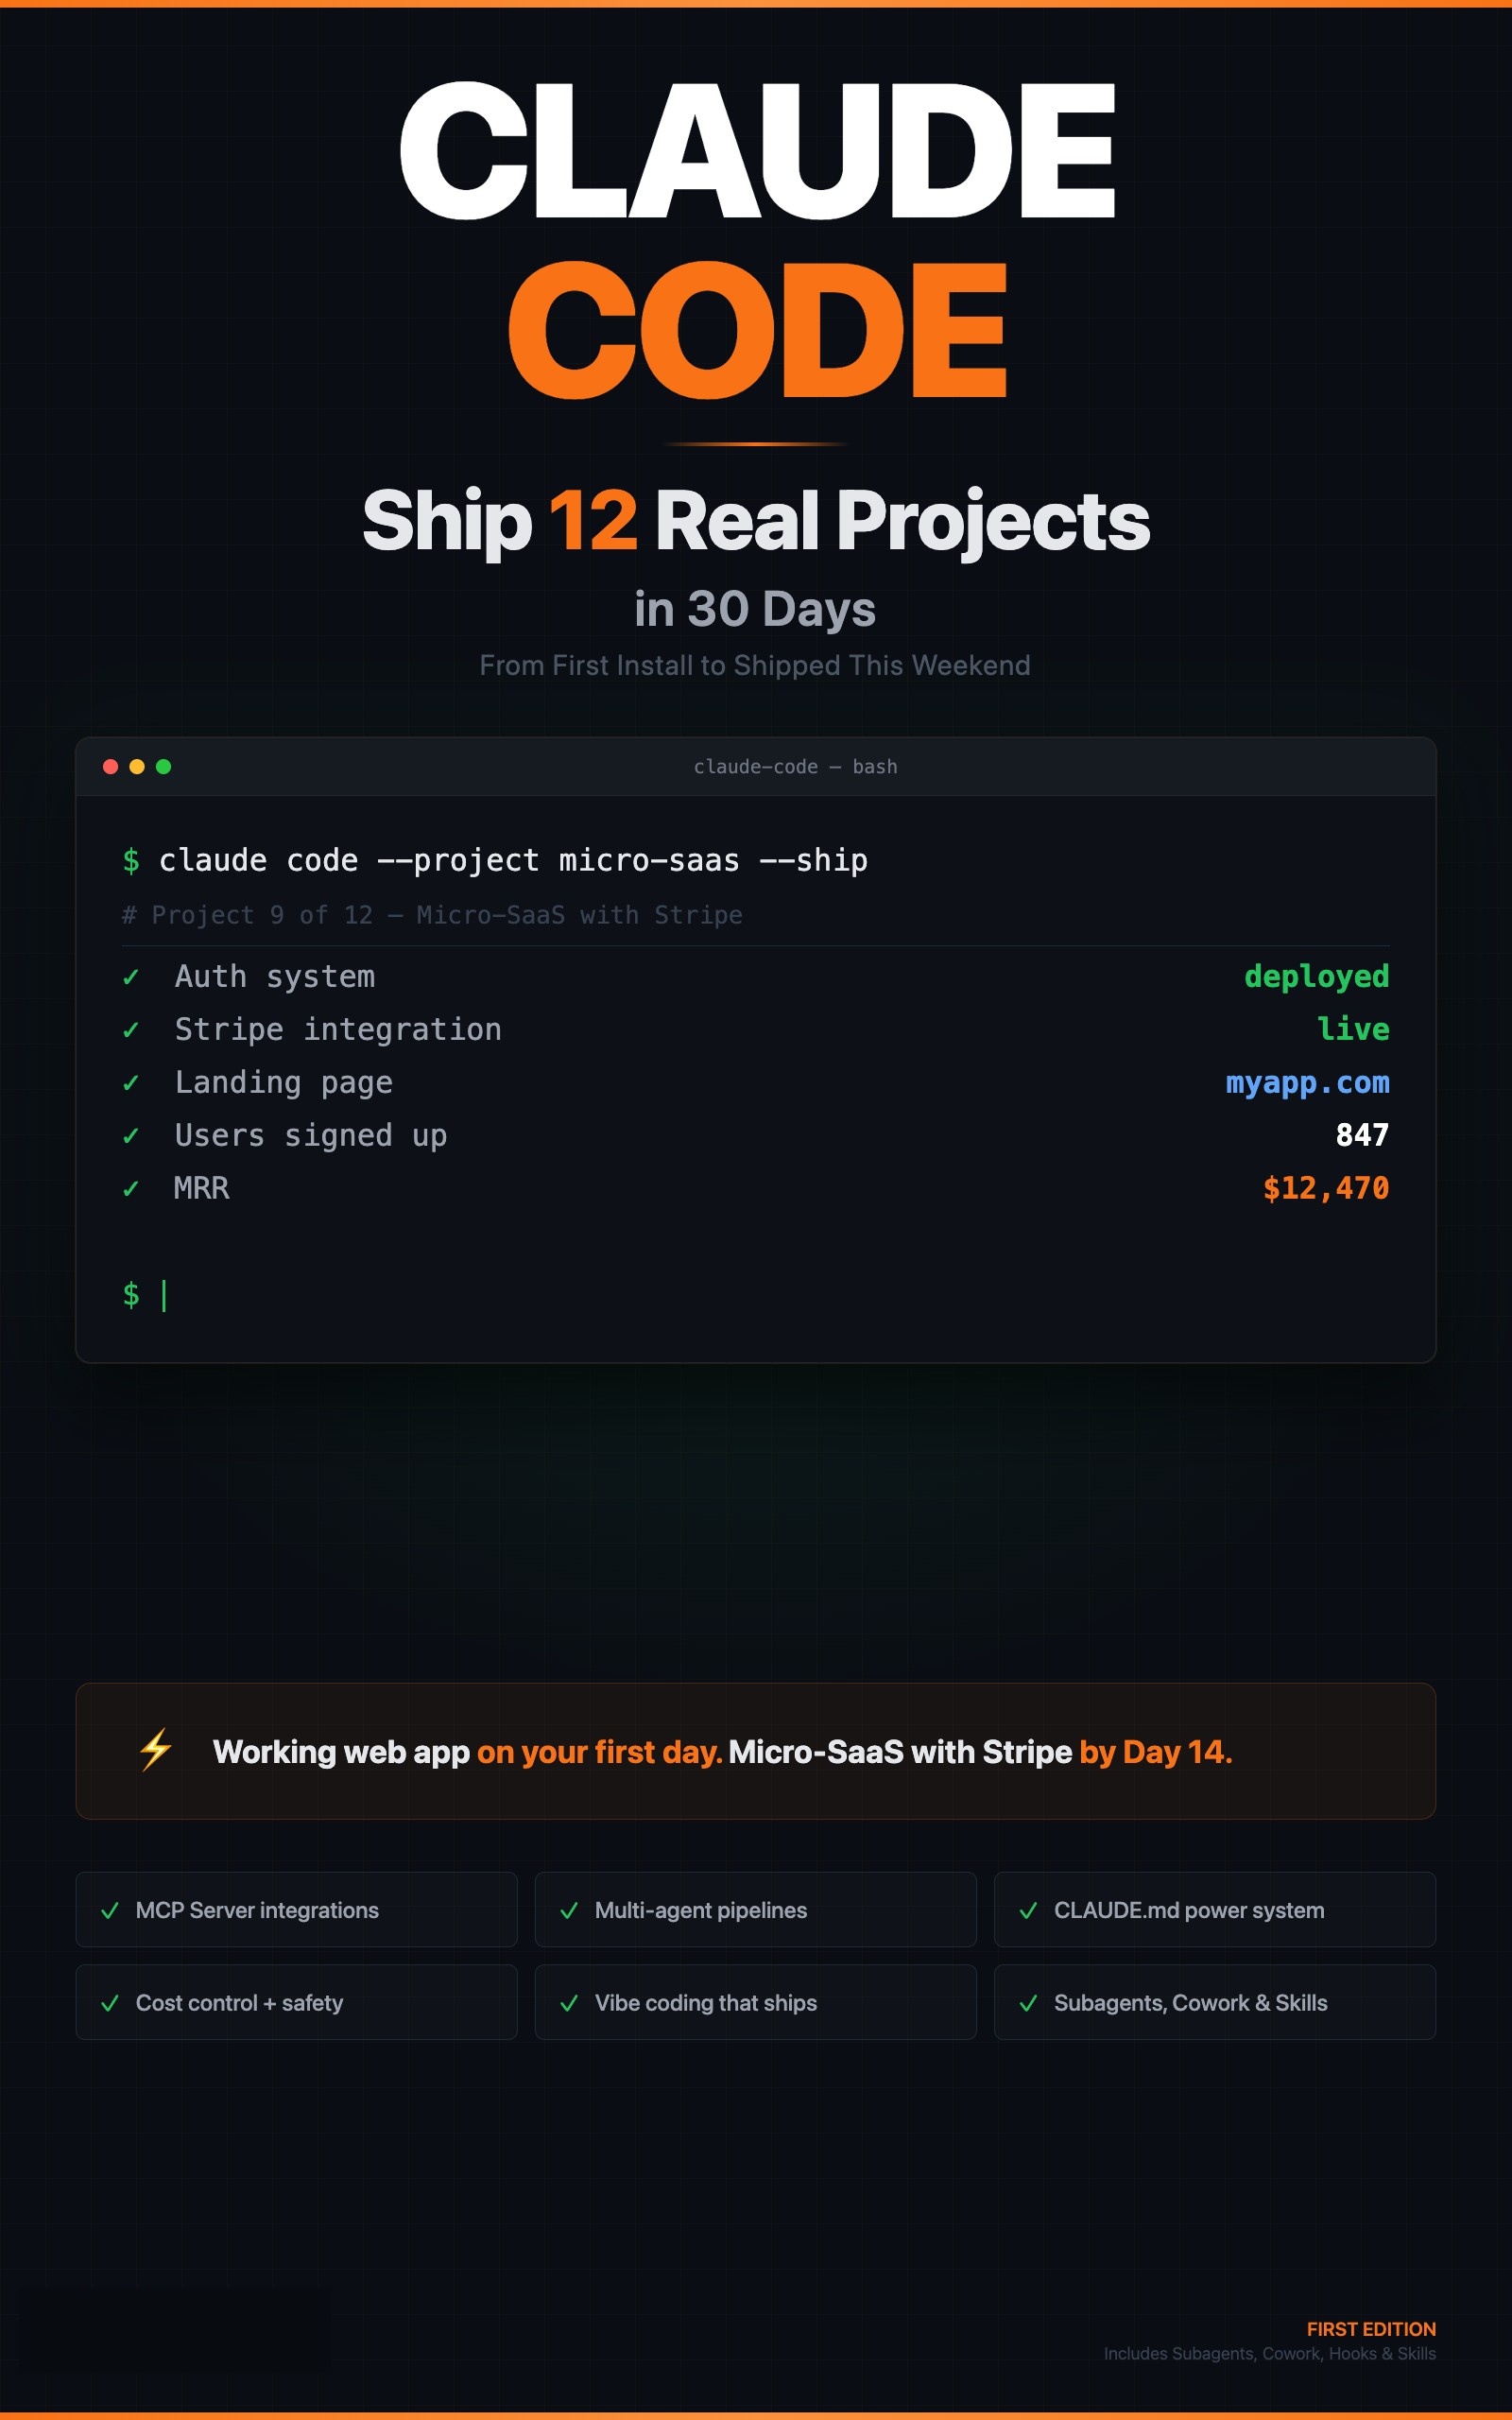
Claude Code: Ship 12 Real Projects in 30 Days
The Hands-On System for Vibe Coding & AI Agents
Summary:
- Build a live-data dashboard with Claude Code in about nine prompts.
- Write zero code by hand. You prompt, evaluate, correct, ship.
- Use a keyless API (Open-Meteo) so there’s no signup friction.
- Expect a wrong endpoint and a rate limit. Both are quick fixes.
You can build a web app with Claude Code without writing a single line of code yourself, and the fastest way to feel it is to ship a real one in an afternoon. Not a todo list. A live-data dashboard that pulls real numbers from a real API and runs in a browser. My first version was ugly and pulled from the wrong endpoint. I built it in eleven minutes. Forty-three minutes after the first prompt, it was something I’d text to a friend.
The trick isn’t that the first output is good. It almost never is. The trick is that the iteration loop is so fast that “wrong” stops being a problem. You prompt, you look, you correct, you ship.
Why a dashboard, not a todo app?
Pick a personal dashboard that pulls live data from a free API. Todo apps teach you nothing: they store data locally and never touch the messy real world. A dashboard forces the actual skills, fetching from an API, parsing JSON, handling the moment the data comes back in a shape you didn’t expect. And you end up with something you’ll open every morning instead of a tutorial project you delete.
One rule for scope: if you can describe it in a sentence with the word “shows,” it’s the right size. “It shows me the weather in three cities.” “It shows me today’s top crypto gainers.” One screen, one API, one HTML file.
Wire up a keyless API you can test right now
Use Open-Meteo. No API key, no signup, CORS-friendly, so it works straight from the browser. You can hit it this second from your terminal:
curl "https://api.open-meteo.com/v1/forecast?latitude=30.27&longitude=-97.74¤t=temperature_2m&daily=temperature_2m_max,temperature_2m_min&timezone=auto"It returns clean JSON:
{
  "current": { "time": "2026-05-27T09:00", "temperature_2m": 19.1 },
  "daily": {
    "time": ["2026-05-27", "2026-05-28"],
    "temperature_2m_max": [25.9, 32.7],
    "temperature_2m_min": [17.8, 19.8]
  }
}
That’s a live response from Open-Meteo, Austin coordinates, current temperature and the daily high/low. Add &temperature_unit=fahrenheit to the URL and you get °F, which is how the dashboard ends up showing “Austin 72°.” Zero signup friction is the whole point: remove every obstacle between you and a working screen.
The nine prompts, start to ship
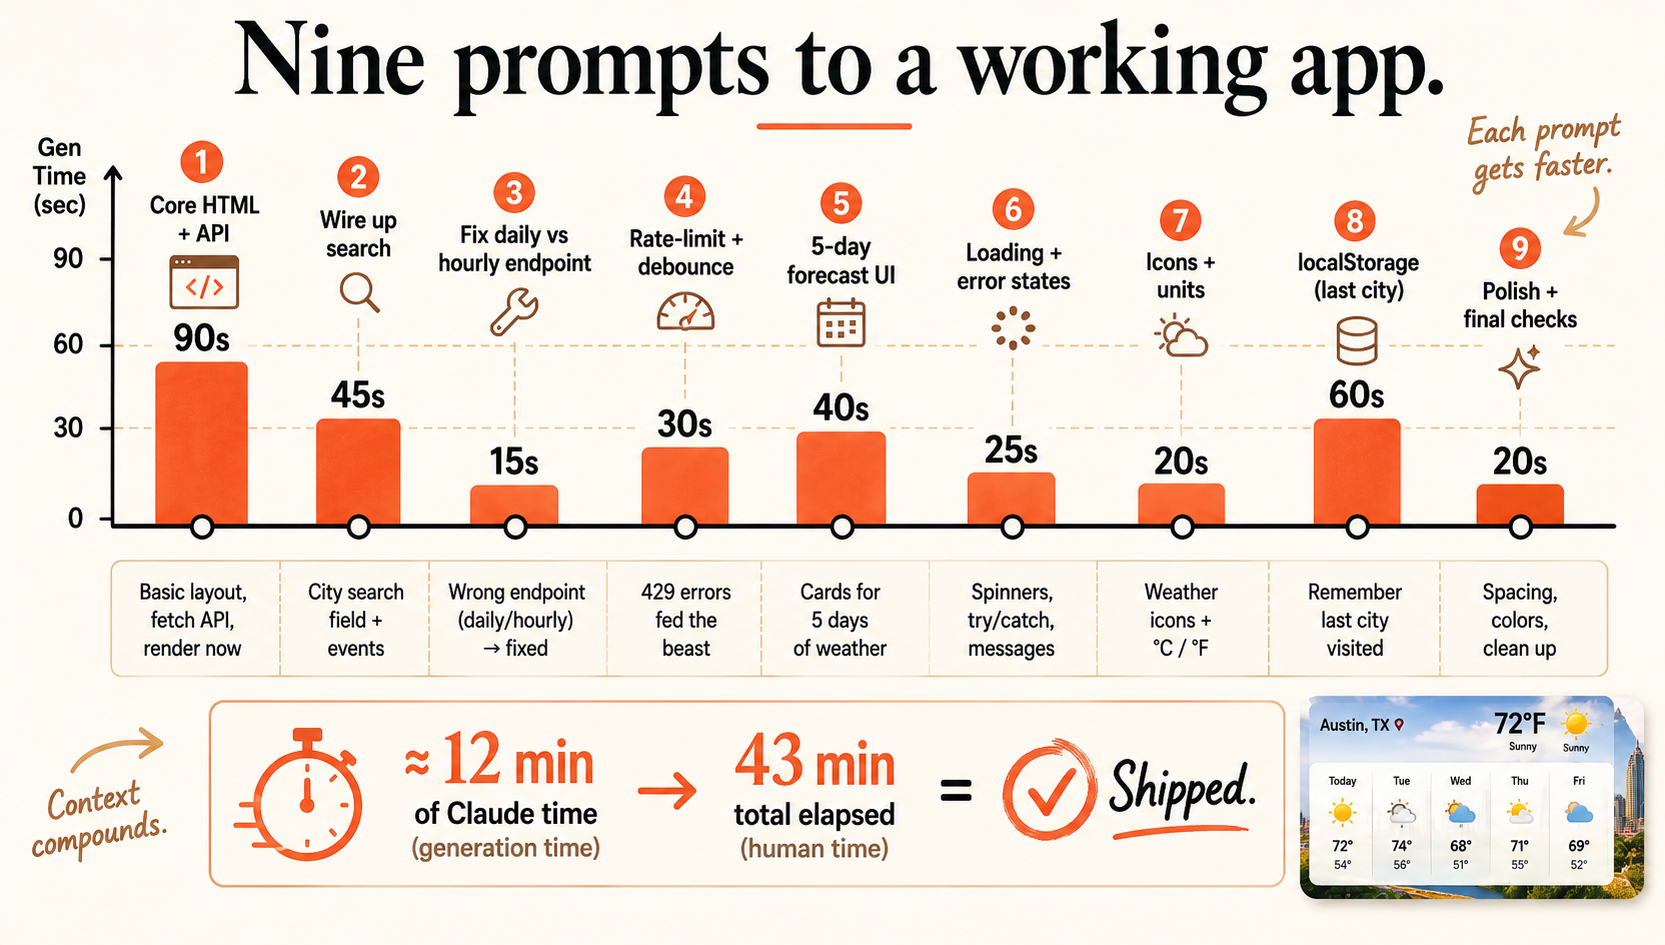
Here’s the real progression from blank directory to working dashboard. Notice the times: each prompt gets faster because Claude Code holds more of your project in context as you go.
| # | Prompt | Gen time |
|---|---|---|
| 1 | Core HTML + API | 90s |
| 2 | Warm up search | 45s |
| 3 | Fix daily vs hourly endpoint | 15s |
| 4 | Rate-limit + debounce (429s) | 30s |
| 5 | 5-day forecast UI | 40s |
| 6 | Loading + error states | 25s |
| 7 | Icons + units (°F) | 30s |
| 8 | localStorage | 60s |
| 9 | Polish + final checks | 20s |
About 12 minutes of Claude generation time. 43 minutes total elapsed, the rest being you looking at the result and deciding what to fix. The bottleneck is never Claude Code. The bottleneck is you figuring out what you want.
Prompt one sets the direction. Paste something like this:
Build a personal dashboard as a single HTML file with inline CSS and JS.
Show current weather for three cities using the Open-Meteo API (no key needed).
Make it look modern and clean.
The “single HTML file” constraint matters. Without it, Claude Code sometimes scaffolds a full framework project with a dozen config files before writing any UI. One file stays simple and debuggable.
What broke: the wrong endpoint and the rate limit
Two failures show up in almost every first build, and they’re both on the chart above (prompts 3 and 4).
The wrong endpoint. The five-day forecast came back as hourly data instead of one row per day. Claude Code had grabbed Open-Meteo’s hourly endpoint when it wanted the daily one. This is the pattern to watch for: reasonable-sounding API calls that are slightly wrong. The fix took fifteen seconds because I named the symptom precisely:
The 5-day forecast is showing hourly data instead of daily. Switch to the daily
endpoint and show one row per day with the high and low.
The rate limit. I added city search, and it worked if you typed slowly. Type fast and it broke, because the geocoding call fired on every keystroke and hit a one-request-per-second limit (the 429s). The fix was a different endpoint plus a debounce:
The search is hitting rate limits. Use Open-Meteo's geocoding endpoint and add a
500ms debounce so it doesn't fire on every keystroke.
The lesson under both: describe the symptom, not “it’s broken.” “The forecast shows hourly data” tells Claude exactly where to look. “Fix the dashboard” tells it nothing.
Ship it to a public URL
Once it works locally, have Claude Code split the single file into index.html, styles.css, and script.js, then deploy. The lowest-friction path is Netlify Drop: open drop.netlify.com, drag your project folder onto the page, and you get a live URL in about ten seconds. No account required for the first deploy. Open it on your phone, send it to someone. It’s real.
What should you actually do?
- If this is your first build: dashboard, keyless API, single HTML file. Constraints make the first session work.
- If the first output is ugly: don’t start over, iterate. Name one specific fix at a time (“dark theme, card layout, large numbers”), not “make it look nice.”
- If a feature breaks: describe the symptom precisely. The wrong-endpoint and rate-limit fixes above each took under a minute because the prompt pointed straight at the problem.
The bottom line
- Nine prompts, about 12 minutes of generation, zero hand-written code, and you have a deployed dashboard.
- The loop is the skill: prompt, evaluate, correct, ship. Every bigger project in the book runs the same loop.
- A wrong endpoint and a rate limit are normal, not failure. Name the symptom and Claude Code fixes it in seconds.
Frequently Asked Questions
Can you build a web app with Claude Code without writing code?+
Yes. You write prompts, Claude Code writes every file. A single-page live-data dashboard takes about nine prompts and roughly 12 minutes of generation time, with no code typed by hand.
What's a good first project to build with Claude Code?+
A personal dashboard that pulls live data from a free, no-key API like Open-Meteo. It forces real API handling and a real layout, unlike a todo app, and you end up with something you actually use.
Why does Claude Code use the wrong API endpoint sometimes?+
It makes reasonable-sounding calls that are slightly off, like Open-Meteo's hourly endpoint when you wanted daily. You fix it by naming the symptom: tell it the forecast is showing hourly data and to switch to the daily endpoint.