Why Is Ollama So Slow? A 6-Step Diagnostic
Your Ollama is stuck at 3 tok/s? The priority-ordered diagnostic that finds the bottleneck in 5 minutes, with the specific fix and a tok/s test for each.
>This walks through the 6 bottlenecks. Master Ollama: The Speed Playbook benchmarks every fix on real hardware.
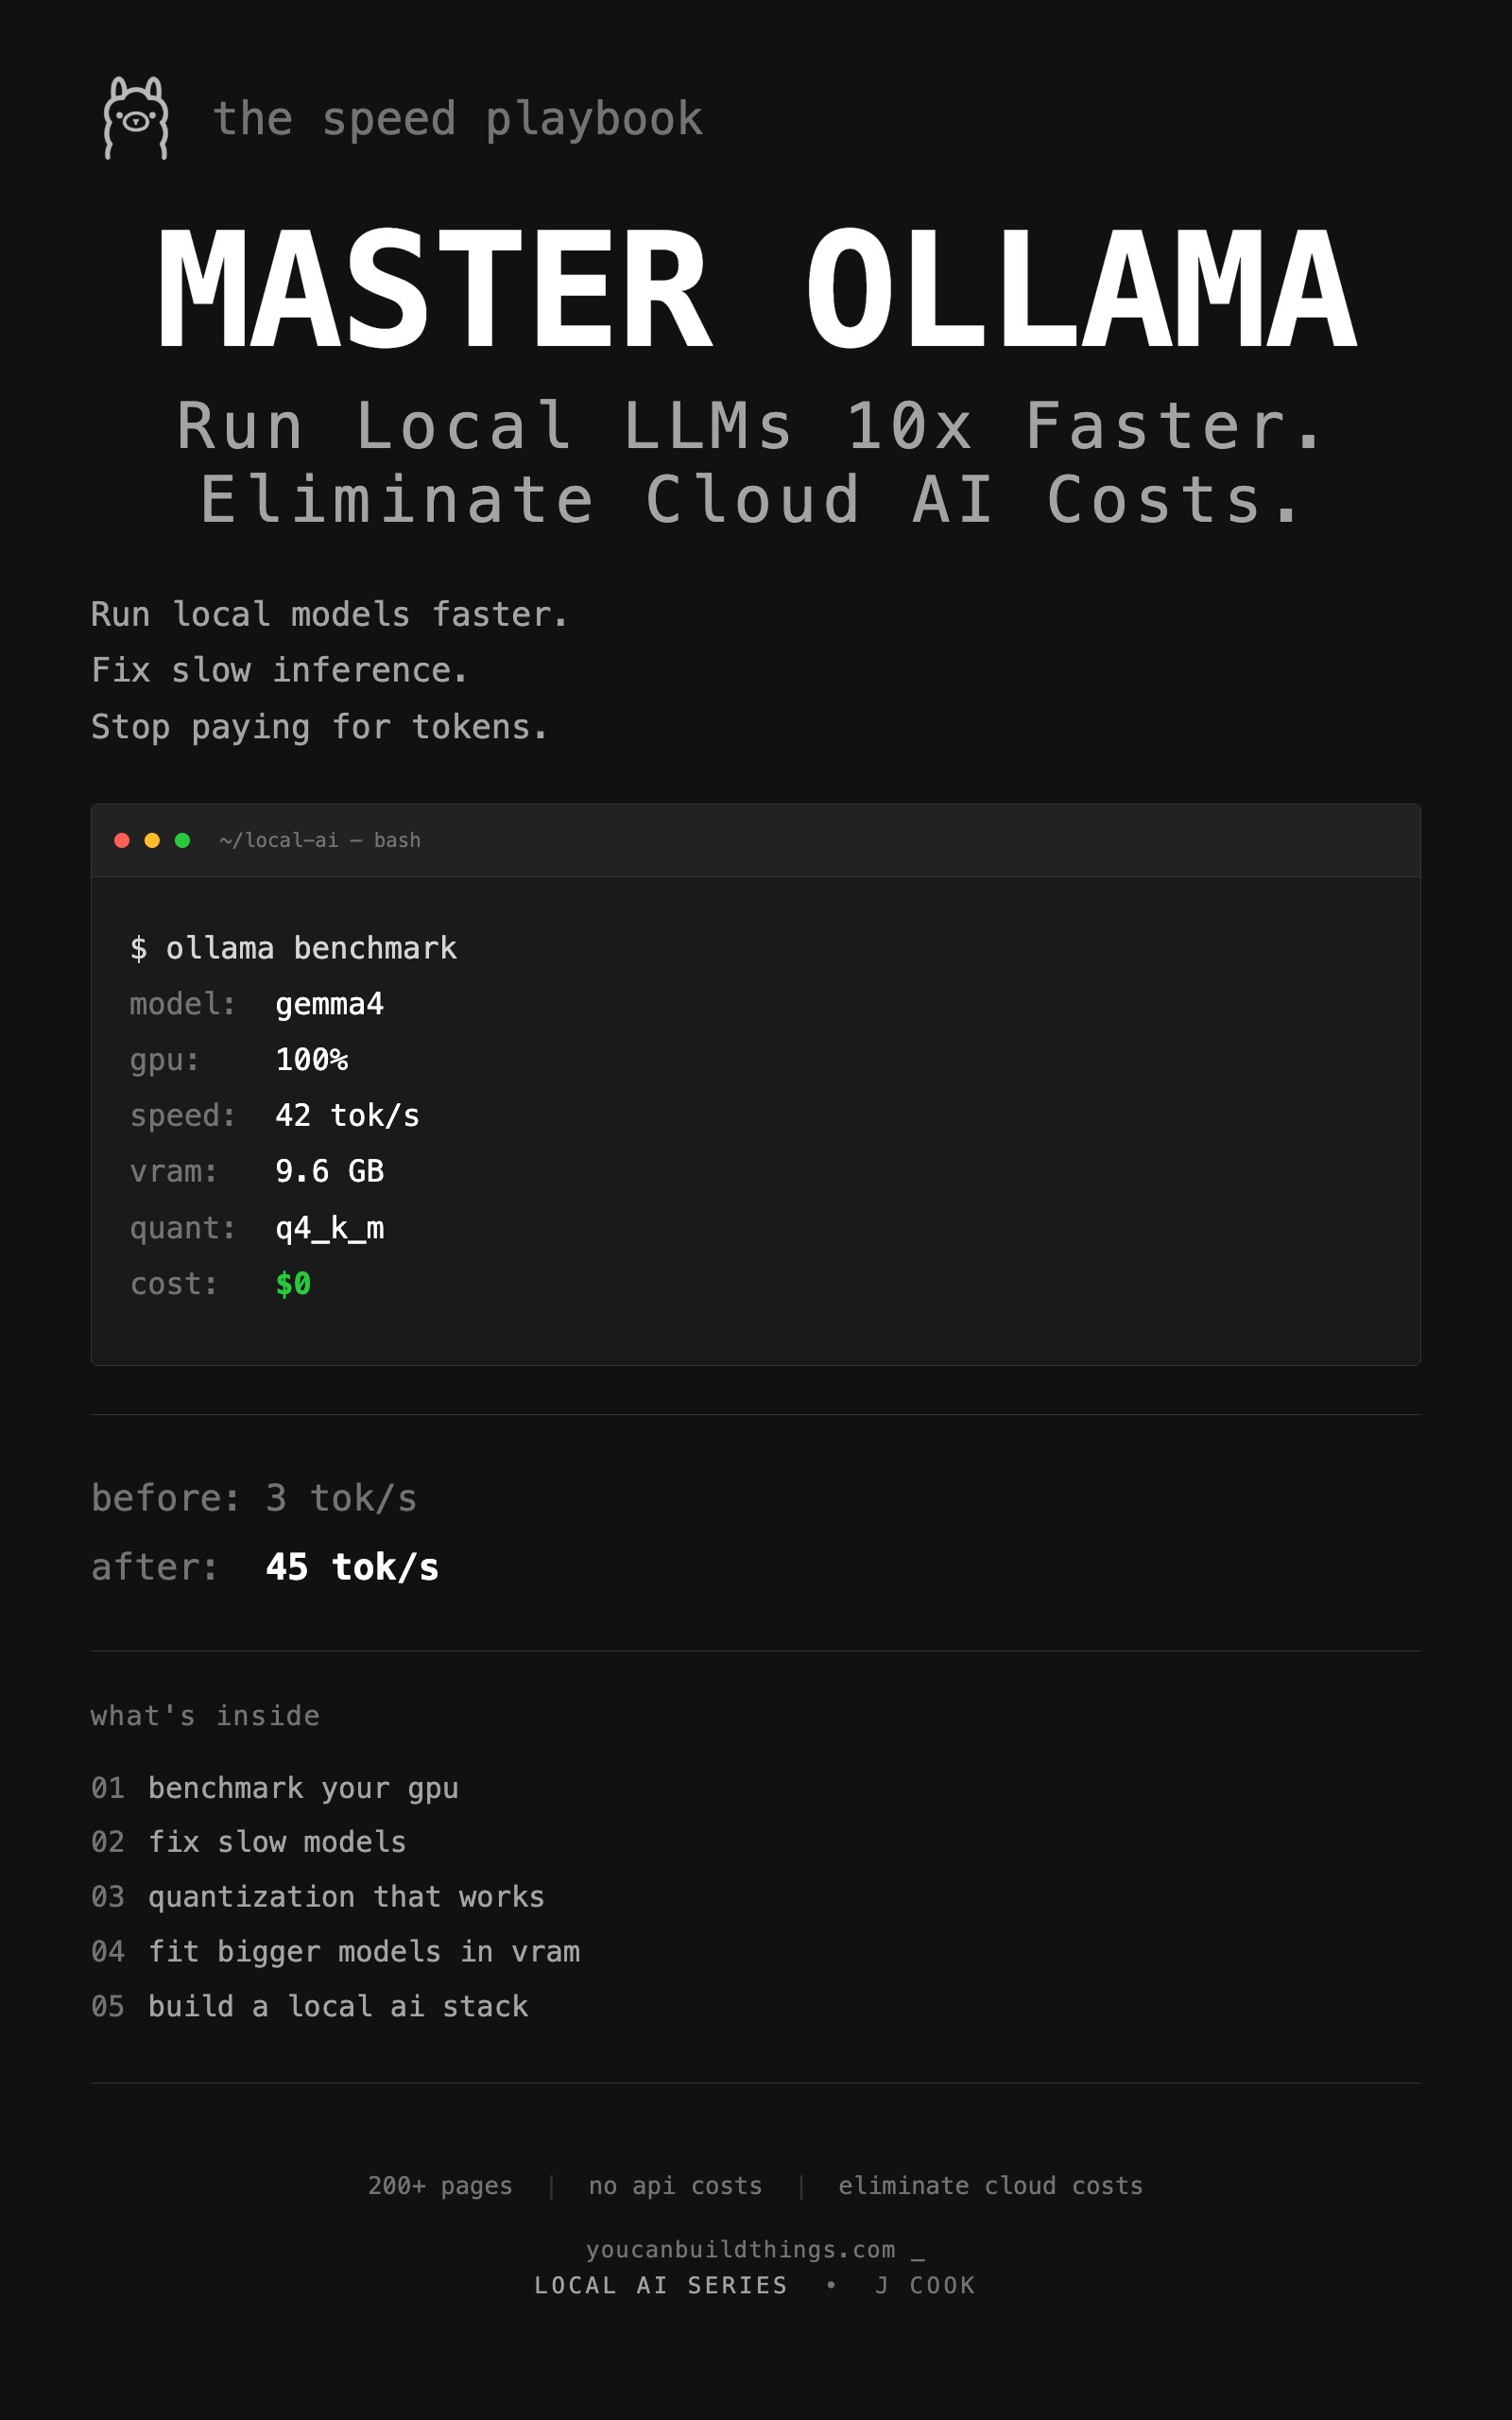
Master Ollama - The Speed Playbook
Run Local LLMs 10x Faster and Eliminate Cloud AI Costs This Weekend
Summary:
- Diagnose the 6 bottlenecks in priority order using
ollama psandnvidia-smi.- The top killer is VRAM offloading. Model spills from GPU to CPU and tok/s collapses.
- Apply the specific fix for your bottleneck and measure tok/s before and after.
- Get a working diagnostic checklist you reuse every time a new model lands.
Why is Ollama so slow on your hardware? Almost always one of six bottlenecks, and the diagnostic takes five minutes. A developer on r/ollama waited 13 minutes for one response and posted about it. The thread hit 774 upvotes. The top reply was “use the GPU” with no procedure. Most replies were variations of the same.
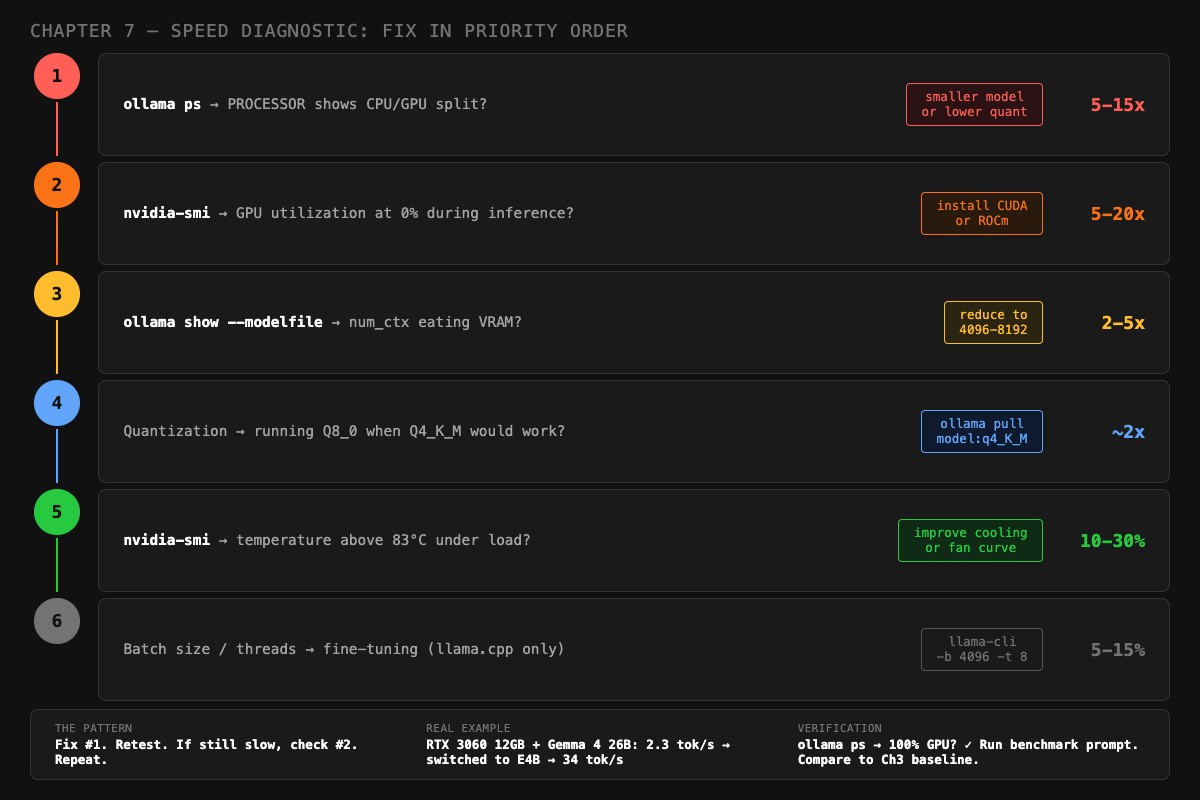
Here is the actual procedure. Six bottlenecks, in priority order. Each one has a specific check, a specific fix, and a measured speed gain. Run them in sequence. Fix #1 first. Retest. If still slow, check #2. Repeat.
What is the #1 cause of slow Ollama?
Almost always VRAM offloading. Speed gain when fixed: 5-15x. Your model is too big for your GPU memory, so it silently spills layers to system RAM. Every token then has to bounce across the PCIe bus, which is orders of magnitude slower than VRAM. Nothing in Ollama’s normal output tells you this is happening.
VRAM offloading is when a model that does not fit entirely in GPU memory has some layers running on CPU instead. The fix is fitting the model in VRAM by picking a smaller variant, dropping to a more aggressive quantization, or shrinking the context window.
To detect it, run this command while a model is loaded:
ollama psLook at the PROCESSOR column:
100% GPU: good. All layers on GPU.48%/52% CPU/GPU: bad. Half on CPU.100% CPU: very bad. GPU not used at all.
Any CPU involvement means a PCIe bus round-trip per token. A 10% CPU split can cut tok/s in half. A 50% split can drop you from 30 tok/s to 3.
Real example from the chapter: an RTX 3060 12GB running Gemma 4 26B at Q4_K_M produced 2.3 tok/s. The 18GB model didn’t fit the 12GB GPU, so 6GB was spilling to system RAM. Switching to Gemma 4 E4B (9.6GB) put the entire model on GPU. Same hardware, 34 tok/s. A 15x improvement from one model swap.
As one r/ollama user with a Lenovo ThinkPad and 32GB RAM put it on the original 774-upvote thread:
“It gave me enough time to go make coffee, drink it, and reconsider my life choices.”
How do you fix VRAM offloading?
Pick the cheapest option from this list that gets PROCESSOR back to 100% GPU:
- Smaller variant. If
gemma3:27bis offloading on 16GB, trygemma3:12borgemma3:4b. The 4B quant is 3.3GB and fits on almost anything. - Lower quantization. If your model is at Q8_0, drop to Q4_K_M. The size roughly halves while quality is barely affected.
- Smaller context window. Drop
num_ctxfrom 16384 to 4096. The KV cache shrinks. Sometimes this is the 1-2GB you needed. - Close GPU-using apps. Browsers with hardware acceleration eat 500MB-1GB. Quit Chrome before benchmarking.
Use this Python helper to read out the exact data you need from the Ollama API in one command:
# diagnose.py: print what ollama ps cannot
import json, subprocess, urllib.request

def diagnose(model: str):
    body = json.dumps({"model": model, "prompt": "Hello", "stream": False}).encode()
    req = urllib.request.Request(
        "http://localhost:11434/api/generate",
        data=body, headers={"Content-Type": "application/json"}
    )
    with urllib.request.urlopen(req) as r:
        d = json.loads(r.read())

    tok_s = d["eval_count"] / d["eval_duration"] * 1e9
    print(f"Model: {model}")
    print(f"Speed: {tok_s:.1f} tok/s")
    ps = subprocess.run(["ollama", "ps"], capture_output=True, text=True)
    print(f"\n{ps.stdout}")

if __name__ == "__main__":
    import sys
    diagnose(sys.argv[1])
Run with python diagnose.py gemma3:12b. You get the tok/s number and the PROCESSOR split in one place.
What if my GPU is sitting idle?
Bottleneck #2: wrong backend. Speed gain when fixed: 5-20x. Your GPU is sitting idle while inference runs on CPU. Common on AMD without ROCm and on NVIDIA with stale drivers.
Check NVIDIA utilization:
watch -n 1 nvidia-smiIf the Ollama process is listed but GPU-Util stays at 0% during generation, Ollama is not feeding work to the GPU. Causes:
- CUDA toolkit not installed
- NVIDIA driver predates Ollama installation
- Ollama service started before the GPU was visible
The fix on Ubuntu:
sudo apt install nvidia-cuda-toolkit
sudo systemctl restart ollama
For AMD, check Ollama’s startup log. If it says vulkan and your GPU is on AMD’s ROCm support list, install ROCm and restart. Vulkan is a fallback that adds an abstraction layer and runs slower than ROCm’s direct hardware path. The difference can be 3x.
Is your context window eating VRAM?
Bottleneck #3: oversized num_ctx. Speed gain when fixed: 2-5x. Your KV cache (the attention state stored during inference) grows linearly with num_ctx. Doubling context doubles its memory cost. Set 32K context on a model that doesn’t need it and the KV cache eats VRAM until model layers spill back to CPU.
Check your current context allocation:
ollama show --modelfile gemma3:12bLook for the num_ctx line. Then compare to this table for a 12B-class model:
| Context length | KV cache cost |
|---|---|
| 2,048 | ~200 MB |
| 4,096 | ~400 MB |
| 8,192 | ~800 MB |
| 16,384 | ~1.6 GB |
| 32,768 | ~3.2 GB |
| 131,072 | ~12.8 GB |
A 26B model at 128K context costs about 22GB just for the KV cache, bigger than the model weights. Just because the architecture supports 256K context does not mean your GPU can afford it.
The fix is a Modelfile that sets num_ctx to what you actually need. The image’s recommended range is 4096-8192 for most setups:
FROM gemma3:12b
PARAMETER num_ctx 8192
PARAMETER temperature 0.3
Save as Modelfile.tuned and create the model:
ollama create gemma3-tuned -f Modelfile.tunedAre you running Q8_0 when Q4_K_M would work?
Bottleneck #4: wrong quantization. Speed gain when fixed: ~2x. Q8_0 is twice the size of Q4_K_M for a quality improvement most people cannot detect on chat or coding tasks. If your model is loaded at Q8_0 and tight on VRAM, dropping to Q4_K_M frees roughly half the weight memory.
Check the tag you pulled:
ollama listIf the tag has no quantization suffix or shows q8, switch to q4_K_M:
ollama pull deepseek-r1:14b-q4_K_MThe size drop is dramatic. DeepSeek R1 14B at Q8_0 is about 14GB; at Q4_K_M it’s 9GB. On a 16GB GPU with a 4096 context, the Q4_K_M version leaves 6GB of headroom while Q8_0 forces offloading. The quality delta on a 10-prompt benchmark suite is usually under 0.2 points on a 1-5 scale.
Is your GPU thermal throttling?
Bottleneck #5: heat. Speed gain when fixed: 10-30%. Your GPU runs fine for the first thirty seconds, then quietly drops its clock as it warms up. The output looks normal. The tok/s number falls.
Check the temperature during inference:
nvidia-smi --query-gpu=temperature.gpu,clocks.gr --format=csv -l 2This polls every 2 seconds. If temperature.gpu climbs above 83°C and clocks.gr (graphics clock) drops below the GPU’s rated boost clock, the card is throttling. On AMD, use rocm-smi --showtemp --showclocks.
The fix is mechanical, not software:
- Improve case airflow. Open the side panel for an immediate test. If tok/s climbs, you have a cooling problem.
- Tune the fan curve. Most BIOS or driver utilities let you set a more aggressive ramp above 70°C.
- Repaste a 2+ year old card. Dried thermal paste can cost you 15°C.
If you cannot reduce temperature, undervolt the GPU. A 50mV undervolt at the same clock saves ~30W of heat and usually leaves performance unchanged.
Should you tune batch size and threads?
Bottleneck #6: only matters if you’re using llama.cpp directly. Speed gain when fixed: 5-15%. Ollama manages these defaults internally and most users cannot tune them. If you’ve already moved to llama-server for raw control, the dials are batch size and thread count.
Increase batch size to 4096 and pin threads at your physical core count (not hyperthreads):
llama-cli -m model.gguf -ngl 99 -fa on -b 4096 -t 8Where -b 4096 is logical batch size, -t 8 matches an 8-core CPU, -fa on enables flash attention. The 5-15% gain is real but it sits below the prior five fixes in priority. Do not tune this until everything above is clean.
What broke
Three real failure modes from the chapter content, with the symptoms and the fix.
Failure 1: 70B model on 16GB GPU. A user pulled llama3:70b (~43GB at Q4_K_M) on a 16GB GPU. The model loaded. Inference ran. Speed was 2.3 tok/s. They blamed the GPU. The fix was switching to llama3:8b (5.2GB). Same hardware, 34 tok/s. The 70B was never going to fit.
Failure 2: context window blowout. A user set num_ctx 32768 for “long conversations.” On a 14B model at Q4_K_M (8.4GB), the 3.2GB KV cache pushed total VRAM use past their 12GB GPU. PROCESSOR went to 65%/35% GPU/CPU. Speed dropped from 22 tok/s to 4. The fix: drop num_ctx to 8192 and rebuild the Modelfile. Speed back to 22 tok/s.
Failure 3: stale driver. A user reported Ollama “ignoring” their RTX 4090. nvidia-smi showed 0% GPU utilization during inference. Their NVIDIA driver was 8 months old, predating their Ollama install. After updating the driver and restarting the Ollama service, GPU utilization jumped to 95% and tok/s went from CPU-tier (4 tok/s) to GPU-tier (60 tok/s).
What should you actually do?
- If
ollama psshows any CPU split → fix VRAM offloading first (smaller model, lower quantization, or smaller context). Verify withollama psshowing 100% GPU. - If
nvidia-smishows 0% utilization during inference → install or update CUDA, restart Ollama. - If
num_ctxis over 16K and PROCESSOR shows a CPU split → drop to 8192 in a custom Modelfile. - If your tag has Q8_0 → re-pull at Q4_K_M.
- If sustained inference slows after 30 seconds → check temperature, fix airflow.
- If you’ve already moved to llama-server and want the last 10% → tune
-band-t.
After every fix, retest with the same prompt and measure. The pattern is: Fix #1. Retest. If still slow, check #2. Repeat.
bottom_line
- VRAM offloading causes 80% of slow-Ollama complaints. Fix that first, before anything else.
- Quantization and thermal throttling are the two bottlenecks people skip. They explain the difference between “fast enough” and “obviously fast.”
- Default settings are tuned for compatibility, not speed. A 30-second Modelfile tweak almost always beats a hardware upgrade.
Frequently Asked Questions
Why does Ollama take 13 minutes for one response?+
Almost always VRAM offloading. Your model is bigger than your GPU memory, so half of it is running on CPU. Run `ollama ps` and check the PROCESSOR column. Anything other than 100% GPU is your bottleneck.
How do I check if Ollama is using my GPU?+
Run `ollama ps` while a model is loaded. The PROCESSOR column tells you the GPU/CPU split. On NVIDIA, also run `nvidia-smi` and watch GPU utilization during inference. Zero percent means Ollama is not using the GPU at all.
Will compiling llama.cpp from source actually double my speed?+
Only if Ollama was already misconfigured. The real overhead between Ollama and a properly-built llama.cpp is 5 to 15 percent. The 2x claims usually come from people who fixed a CPU-fallback bug, not from the engine itself.