How to Analyze Messy Spreadsheets with Claude (No Code)
Analyze a spreadsheet with AI, no code: drop a messy CSV into Claude and get a clean dataset, a documented cleaning log, and a plain-English report fast.
>This is the audit-clean-report loop for one file. Claude Cowork - Automate Your Job This Weekend goes deeper on reconciling two data sources, the weekly auto-report, and selling clean data as a service.
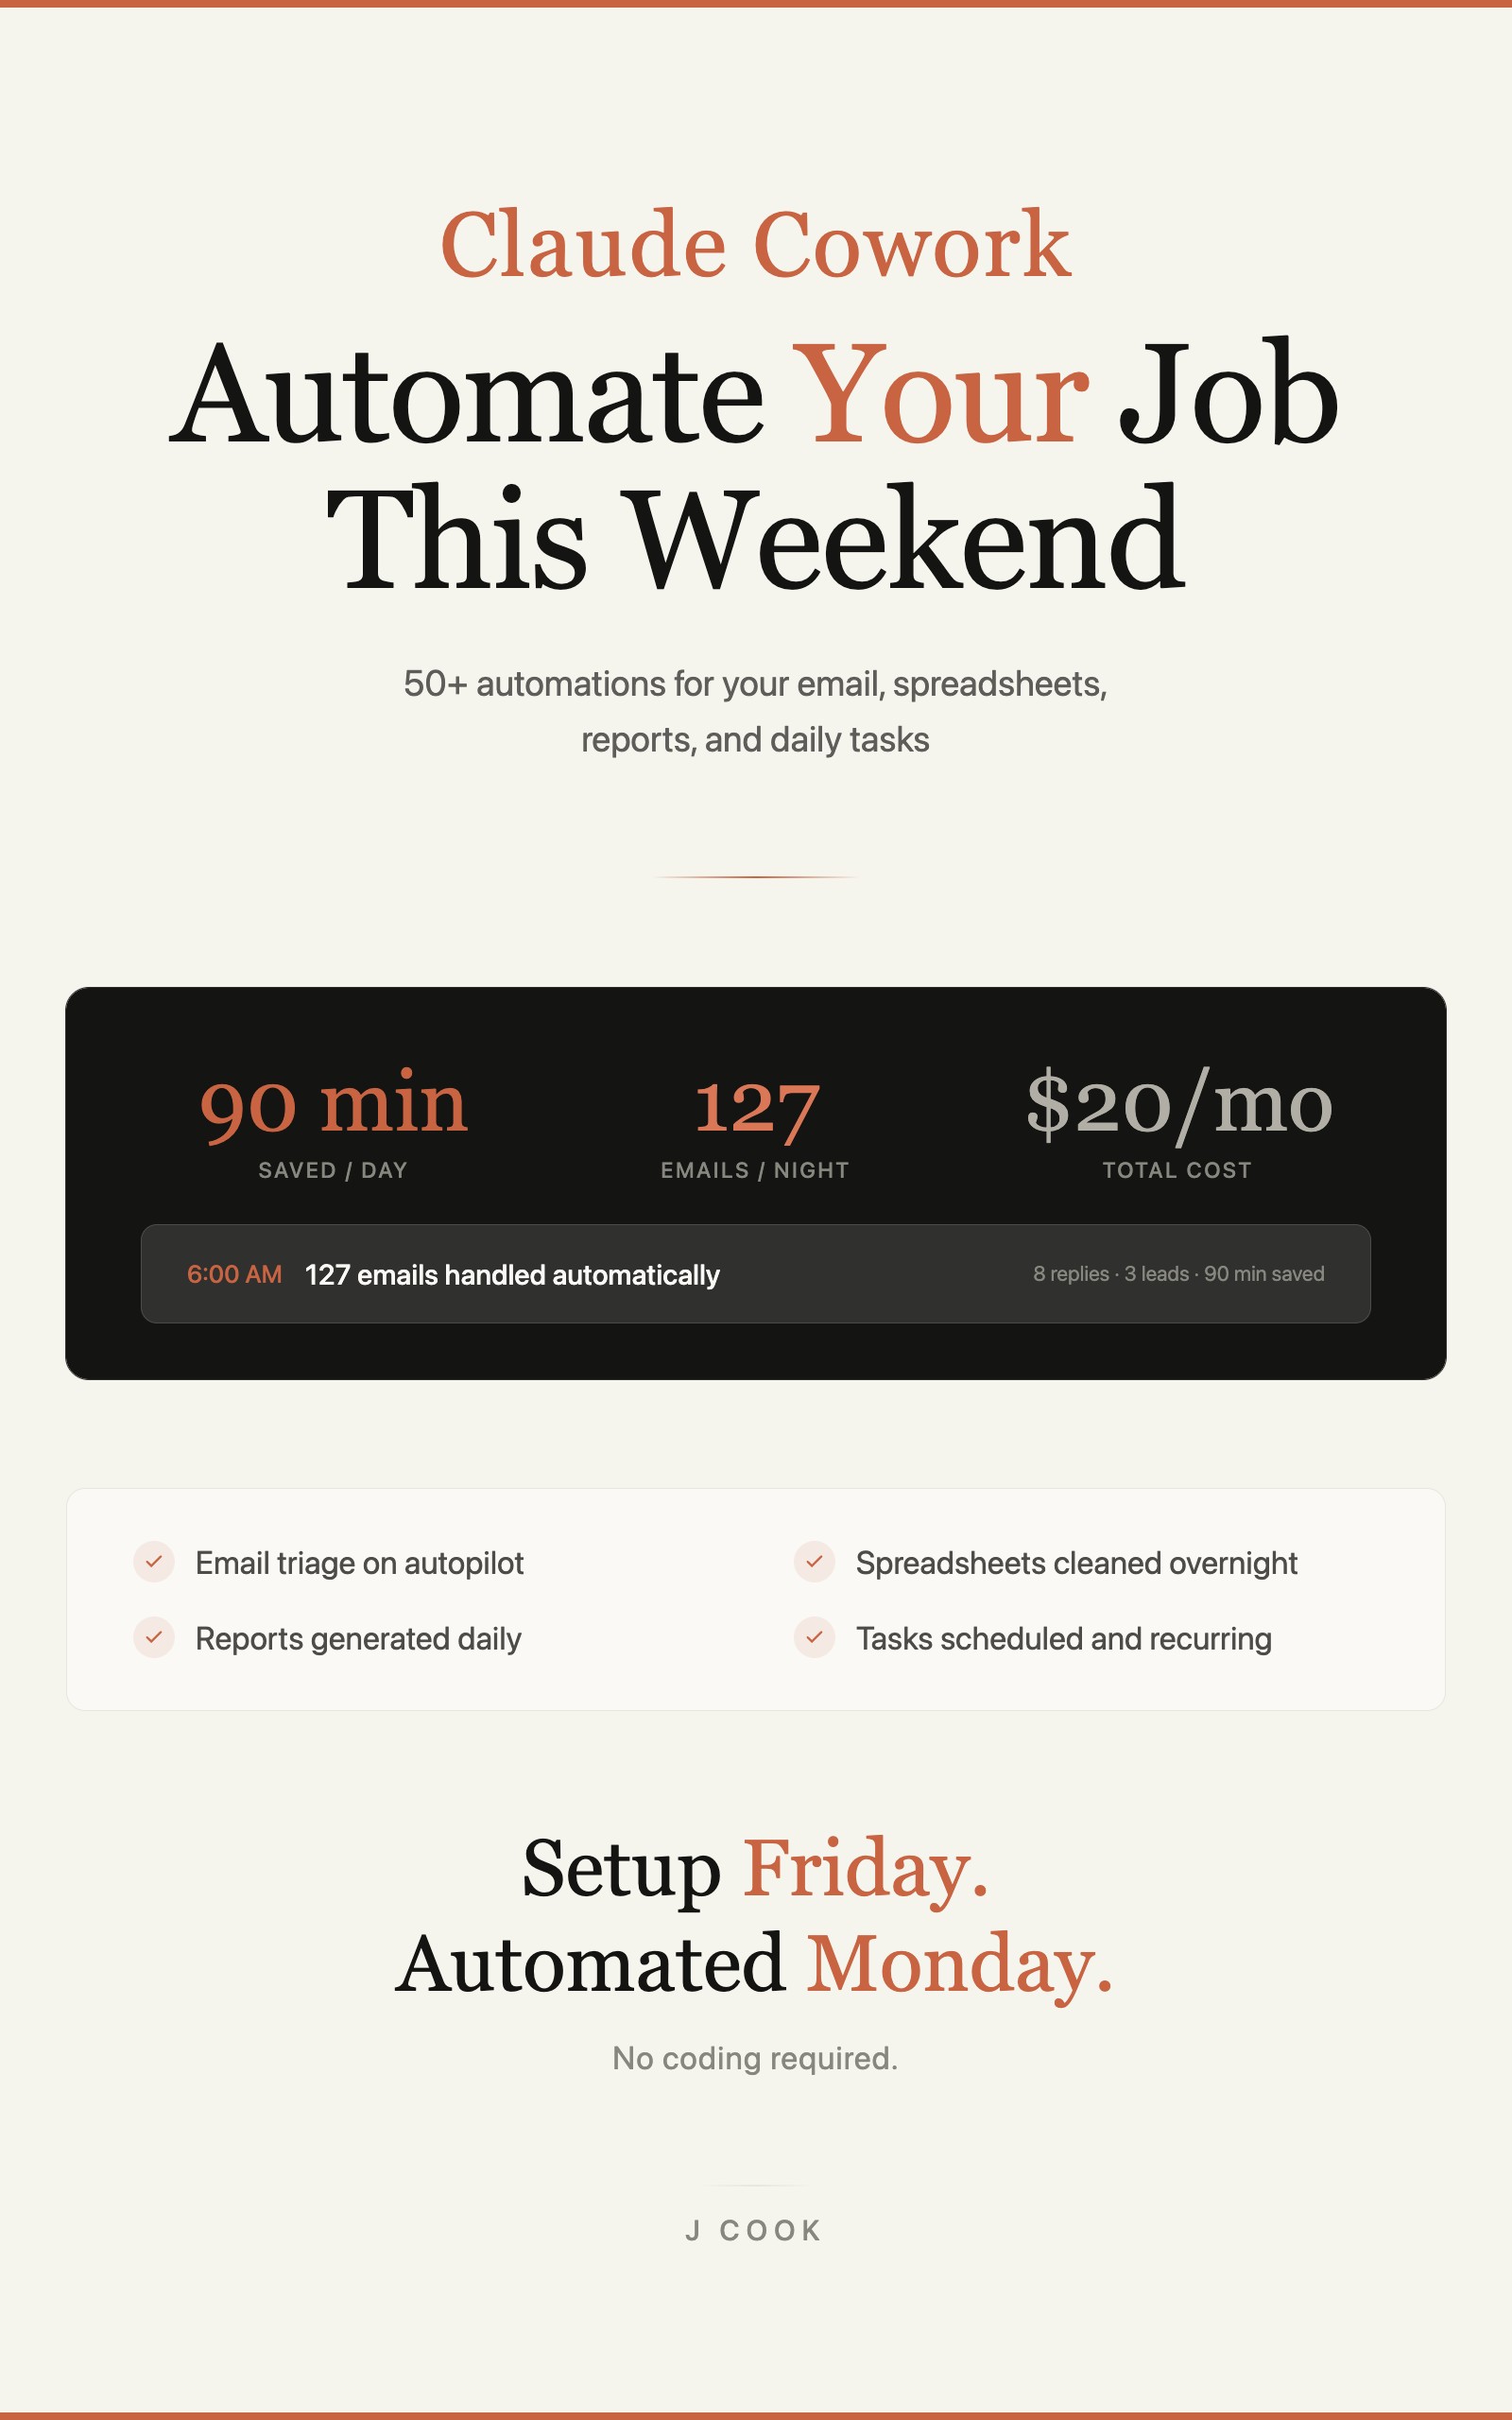
Claude Cowork - Automate Your Job This Weekend
50+ Automations for Email, Spreadsheets, Reports, and Daily Tasks Using Claude Computer Use
Summary:
- The audit, clean, report loop that turns a junk CSV into a deliverable.
- The cleaning log that makes your work traceable (and gets you repeat business).
- The verify step that catches a wrong number before it reaches a board deck.
- Where Claude stops being a data analyst, so you know what not to trust it with.
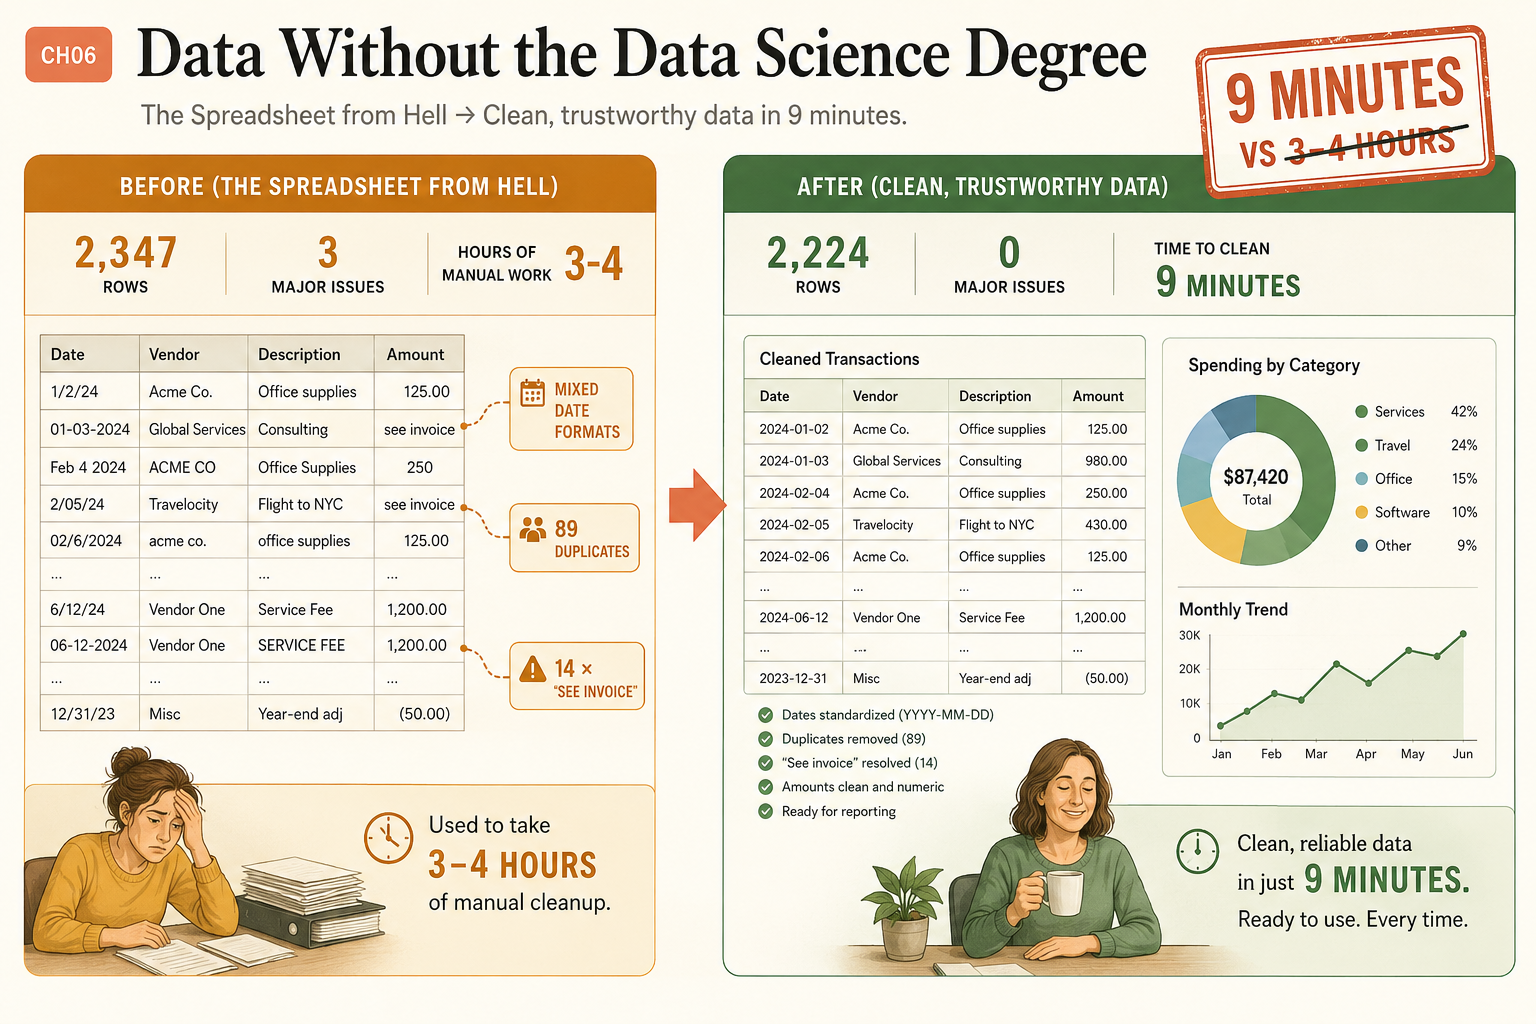
A data analyst charges upward of $75 an hour to produce what this builds, and you will not open Excel once. You searched some version of “analyze spreadsheet with AI no code,” and what you actually want is the workflow, not another listicle: drop a messy file in, get clean data and a real report out. The worst file I ever got was a client CSV with 2,347 rows, mixed date formats in the same column, 89 duplicates, and 14 cells in the Amount column that just said “see invoice.” I used to spend 3 to 4 hours hand-cleaning files like that. Claude did it in 9 minutes.
How do you analyze a messy spreadsheet with Claude, no code?
You get the file to Claude, then run it through four steps: audit, clean, verify, report. No Excel formulas, no Python.
First, getting the file to Claude. Three ways:
- A CSV in a connected folder. The fastest path. Claude reads the raw file directly instead of screenshotting it. This needs the file in a folder you connected, or reachable through the filesystem MCP server.
- Google Sheets via the Workspace connector. Name the sheet, Claude reads the cells directly through the connection.
- Paste it in. For anything under 100 rows, copy the data straight into the chat.
For the direct-read path, the filesystem MCP server is what makes it work. Here is the working config, straight from the modelcontextprotocol/servers repo:
{
  "mcpServers": {
    "filesystem": {
      "command": "npx",
      "args": [
        "-y",
        "@modelcontextprotocol/server-filesystem",
        "/Users/username/Desktop",
        "/path/to/other/allowed/dir"
      ]
    }
  }
}
Swap in your username and the folders you want Claude to reach. If Claude ever says it cannot access your file, this connection (or a connected folder) is the missing piece.
Step 1: Audit the data first
Never let Claude change anything before it tells you what is wrong. Send this:
Read test-data.csv on my Desktop. Audit the data quality: total
rows, columns with names and types, and any issues (duplicates,
missing values, inconsistent formats, outliers). Do not fix
anything yet. Save the audit as data-audit.txt on my Desktop.
For 2,347 rows, the audit takes about 2 to 3 minutes and comes back like this:
DATA QUALITY AUDIT - test-data.csv
Rows: 2,347

ISSUES FOUND:
1. DUPLICATES: 89 rows (34 exact, 55 near-duplicates)
2. DATE FORMAT: 3 incompatible formats in one column
   (MM/DD/YYYY, DD-Mon-YY, DD/MM/YYYY)
3. MISSING DATA: 14 "see invoice" entries in Amount, 12 empty dates
4. CASE INCONSISTENCY: "Office Supplies" / "office supplies" /
   "OFFICE SUPPLIES" treated as 3 categories
Every line is a decision point. You decide how each issue gets handled. Claude executes.
Step 2: Clean it, with a log
After reviewing the audit, send the cleanup rules. The non-negotiable part is the cleaning log:
Using the audit, clean test-data.csv: 1) standardize all dates to
YYYY-MM-DD. 2) remove exact duplicates, flag near-duplicates with
"REVIEW" in Notes. 3) replace "see invoice" amounts with 0 and add
"MISSING AMOUNT" to Notes. 4) Title Case all categories. Save as
test-data-cleaned.csv. Also save cleaning-log.txt recording every
change with the original value and the new value.
The log is your paper trail. When the client asks “why did this row change,” you point to it. The cleaned file comes back at 2,224 rows (89 duplicates gone, dates standardized to YYYY-MM-DD, 14 “see invoice” cells resolved), down from the 2,347 you started with. Zero major issues, in about 9 minutes against the 3 to 4 hours it used to take by hand.
| Before | After | |
|---|---|---|
| Rows | 2,347 | 2,224 |
| Major issues | 3 | 0 |
| Duplicates | 89 | 0 |
| ”See invoice” cells | 14 | resolved |
| Dates | 3 mixed formats | YYYY-MM-DD |
| Time | 3-4 hours | 9 minutes |
Step 3: Verify before you trust it
The cleaning log tells you what changed. A reconciliation tells you whether it was right. For anything financial, this step is not optional:
Compare test-data.csv and test-data-cleaned.csv. Report the row
count before and after, the sum of the Amount column before and
after, and every row where Amount changed. Confirm the only Amount
changes are the 14 "see invoice" rows set to 0. Flag anything else.
If the row count dropped by anything other than your 89 removed duplicates, or the Amount total moved by anything besides those 14 known edits, you catch it here instead of in a client’s board deck.
Step 4: Generate the report
Clean data is not the deliverable. The report is:
Read test-data-cleaned.csv. Write analysis-report.md with:
1) Executive Summary (3-4 sentences, no jargon). 2) Key Metrics
(total, average, largest transaction, top category, top vendor).
3) Trends (monthly breakdown, top 5 categories by spend). 4)
Anomalies. 5) Recommendations (3-5 specific actions). Plain English
only, for a reader with no data background.
The report comes back with the headline numbers a board wants: a total spend of $87,420, broken down by category as Services 42%, Travel 24%, Office 15%, Software 10%, and Other 9%, plus a month-by-month trend. That is the document you hand a client. It looks professional because structured data formatted cleanly looks professional automatically.
What broke (and the fix)
Screenshots lie about numbers. I once had Claude read an invoice total from a PDF on screen. It showed “$12,450.00” in a stylized font, and Claude read it as “$12,950.00” because the 4 looked like a 9 at screenshot resolution. A $500 error that would have shipped into a reconciliation report if I had not checked.
The fix is the whole reason Step 1 reads the file directly: file reads are character-perfect, screenshot reads are not. When accuracy matters (dollar amounts, dates), get the data through a connected folder or connector, never a screenshot. The other silent killer is date ambiguity. “03/04/2025” is March 4th or April 3rd depending on the row, and Claude guesses unless you tell it. Add “interpret ambiguous dates as MM/DD/YYYY” to your cleanup prompt, or your analysis quietly corrupts.
What should you actually do?
- If your file is a CSV → put it in a connected folder (or wire the filesystem MCP server) so Claude reads it directly. Fastest and most accurate.
- If it is in Google Sheets → use the Workspace connector, or export to CSV for large sheets.
- Always audit before you clean. The two-minute audit saves a twenty-minute undo.
- For any financial data → run the Step 3 reconciliation and eyeball five random rows. Two minutes of checking beats a wrong number with your name on it.
- If your data tops ~10,000 rows, needs real statistical modeling, or is a live dashboard → use a database or BI tool. Claude is for the messy mid-size files, not those.
The bottom line
- The cleaning log is what separates professional data work from amateur hour. Every change traceable means a client questions nothing.
- Read the file, do not screenshot it. The $500 misread is the difference between character-perfect file access and a fuzzy picture of a number.
- Audit, clean, verify, report. The numbers and rules change file to file. The four-step loop never does.
Frequently Asked Questions
Can I analyze a spreadsheet with AI without writing any code?+
Yes. You drop a CSV into a folder Claude can read, then ask it to audit, clean, and report in plain English. No Excel formulas, no Python, no code at all.
How big a spreadsheet can Claude handle?+
Claude works well up to about 5,000 to 10,000 rows. Beyond that, processing gets slow and you risk conversation limits. For 50,000+ rows, use a real database tool.
How do I get my CSV to Claude?+
Three ways: keep it in a connected folder or the filesystem MCP server so Claude reads it directly, open it in Google Sheets via the Workspace connector, or paste datasets under 100 rows straight into the chat.