Why Your Local AI Coding Agent Is Slow
Why is Ollama slow for coding? Almost never your hardware. Fix the 52-second tool call with three knobs: model size, quantization, and context length.
>This covers the slow tool call. Run Claude Code Locally goes deeper on wiring the agent, picking your model, and the full troubleshooting runbook.

Run Claude Code Locally
Kill the $300 AI Bill with Free, Private Coding Agents on Ollama and Open Models
Summary:
- Why the 52-second tool call is a memory problem, not a hardware verdict.
- The three knobs that fix it: model size, quantization, context length.
- A hardware tier table matching your RAM to a model that fits.
- How to tell thrashing apart from a tool-call problem in ten seconds.
Asking “why is Ollama slow for coding” misses the real culprit: it’s almost never your hardware. The 52-second tool call that makes people quit local coding on day one is a memory problem with a knob, not a verdict on your laptop. The same setup that gives you a 52-second call can give you a 4-second one after twenty minutes of tuning.
What’s actually slow? Diagnose before you touch anything
A tool call that takes 52 seconds is almost never the model thinking hard. It’s one of two things, and the fix is different for each, so spend ten seconds finding out which before you change a setting.
Open your memory monitor (Activity Monitor on macOS, your system monitor elsewhere) and run the slow task again while you watch. You’re looking for one thing: is memory pegged near your total with the disk busy, or is memory comfortable while the model just churns? You can also check what’s loaded:
ollama psIf memory is in the red, it’s thrashing: the model plus context overran your RAM, so the machine is swapping to disk and waiting on I/O instead of computing. That’s your 52 seconds. If memory is fine but the model keeps stumbling on tool calls specifically, it’s a different problem with the opposite fix. Diagnosing first is the whole game; changing knobs blind is how people “fix” the wrong problem and conclude nothing works.
The three knobs that fix it
Every slowness fix is one of three knobs, and they all point at the same goal: keep the working set in RAM.
Knob 1, model size. The instinct is to run the biggest model that loads. For coding, that instinct costs you. A model that’s slightly smarter but noticeably slower is a worse daily driver than a fast one that’s plenty smart for everyday work. Size is in the tag: qwen2.5-coder:3b, :7b, :14b, :32b.
Knob 2, quantization. This is how much the model is compressed, trading a little quality for much less memory and more speed. You choose it in the tag, the part after the colon, not a flag:
ollama pull qwen2.5-coder:7b-instruct-q4_K_MThat q4_K_M is a popular sweet spot: roughly four-bit precision, which cuts memory dramatically while keeping quality high enough that most people can’t tell the difference on coding tasks. There is no ollama pull --quantize flag. The tag is the knob.
Knob 3, context length. From the Ollama FAQ, the verbatim mechanism:
By default, Ollama uses a context window size of 4096 tokens. This can be overridden with the OLLAMA_CONTEXT_LENGTH environment variable. For example, to set the default context window to 8K, use:
OLLAMA_CONTEXT_LENGTH=8192 ollama serveSource: docs.ollama.com/faq. To change it for a single session instead of the whole server, the same FAQ gives you a runtime override inside ollama run:
/set parameter num_ctx 8192Context costs memory: a bigger window means more RAM goes to holding the conversation. You raise it when the model forgets earlier files; you lower it when the machine is swapping.
Match the model to the machine you already own
Here’s the whole tuning conversation in one table. Find your row and start from a configuration that fits, instead of guessing.
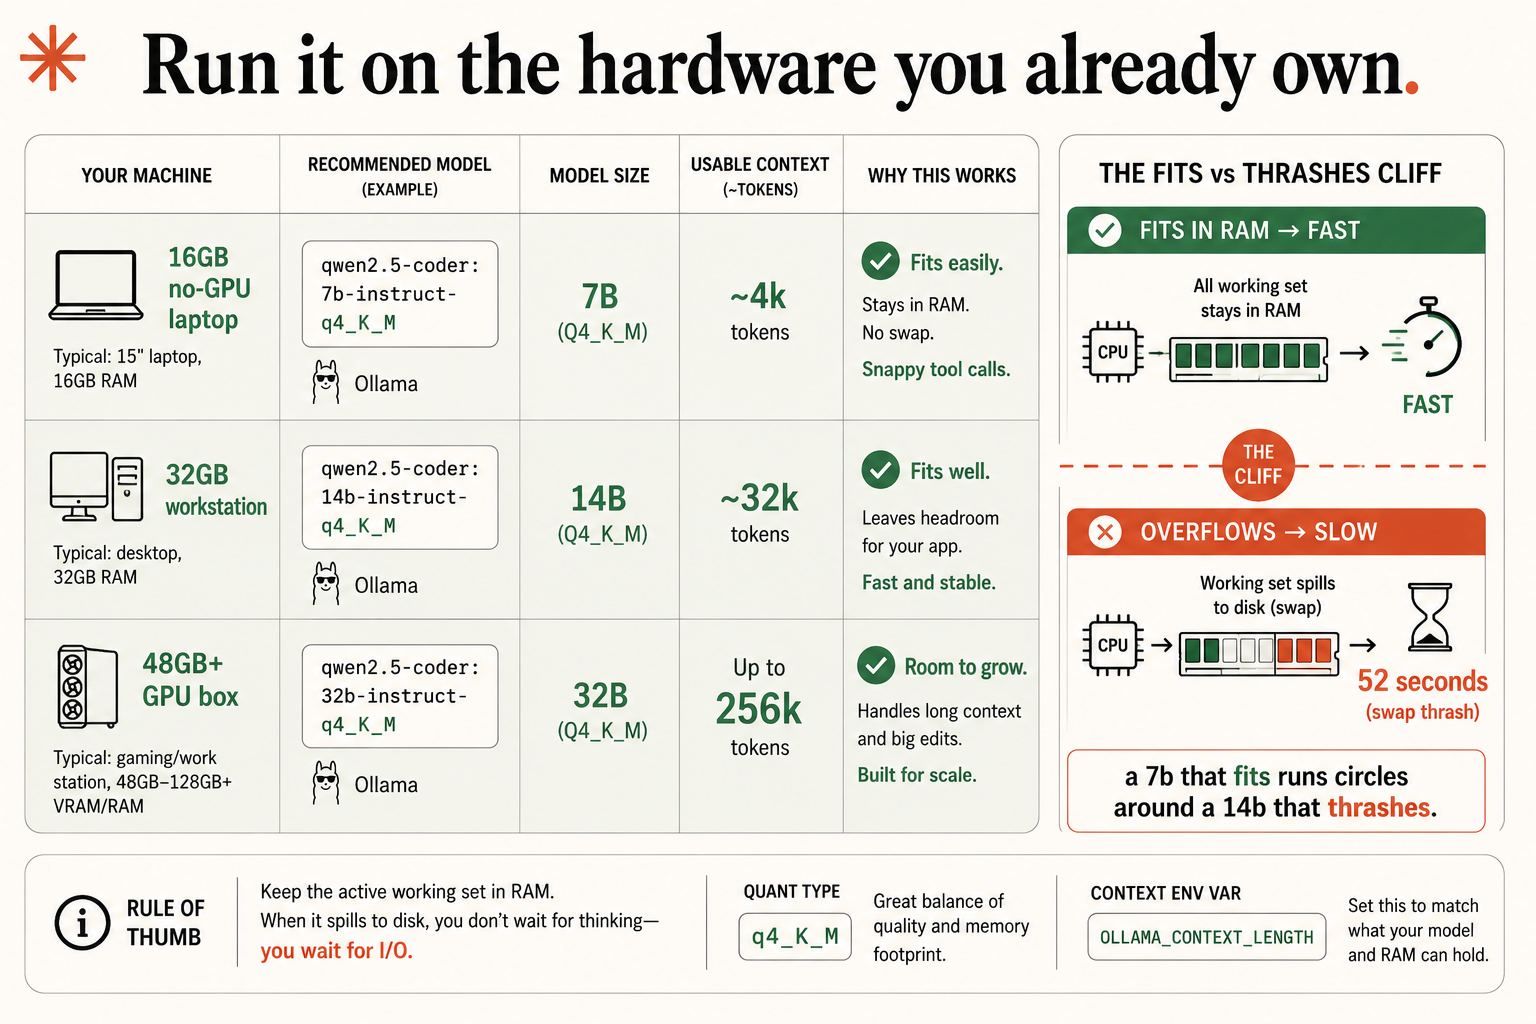
| Your machine | Recommended model | Size | Usable context | Why this works |
|---|---|---|---|---|
| 16GB no-GPU laptop | qwen2.5-coder:7B-instruct-q4_K_M | 7B | ~4k tokens | Fits easily. 7B in RAM. Snappy tool calls. |
| 32GB workstation | qwen2.5-coder:14B-instruct-q4_K_M | 14B | ~32k tokens | Fits well. Room for context. Fast and stable. |
| 48GB+ GPU box | qwen2.5-coder:32B-instruct-q4_K_M | 32B | up to 256k tokens | Room to grow. Handles long context and big edits. |
The numbers are recommended targets you set, not magic. On 16GB, target around 4k of context; on 32GB the 32k tier is comfortable; on a 48GB+ box you can push context toward 256k. Set it explicitly when you need it, with the variable above.
What broke: the fits-versus-thrashes cliff
Here’s the failure mode behind almost every “local is too slow” complaint, and why the three knobs work as a system.
When the model plus its context plus everything else fits in RAM, the model runs at the speed your hardware can actually do. When it doesn’t fit, your operating system starts shuffling data between RAM and your much slower disk. That shuffling is swapping, and constant swapping under load is thrashing. A thrashing machine isn’t doing math slowly; it’s spending most of its time moving data instead of computing, which is why it doesn’t feel a little slow, it feels broken. That’s your 52-second tool call. The model isn’t thinking for 52 seconds. It’s waiting on the disk for most of them.
This is why all three knobs aim at the same target. A smaller model, a lighter quantization, a tighter context: each is a way to get the whole working set into fast memory. The cliff between “fits” and “doesn’t fit” is enormous, far bigger than the gentle slope of “slightly bigger model.” A 7B that fits runs circles around a 14B that thrashes, even though the 14B is “better,” because the 14B spends its life waiting on disk.
Two slow cases, two opposite fixes
The diagnosis from the start pays off here, because the two causes need opposite moves.
Memory red while it hangs? Thrashing. Drop the model size one notch (:14b to :7b), and if it’s still tight, lower the context length. Get comfortably back inside RAM with headroom, and the freezes stop completely.
Memory fine but the model keeps stumbling on tool calls? Counterintuitively, raise the context window. Both Codex’s and OpenCode’s docs recommend more context specifically to make tool-calling reliable, because the model needs room to keep the tool definitions and the conversation in view at once. That’s the opposite of the thrashing fix, which is exactly why you diagnose first.
What should you actually do?
- If a tool call hangs, check your memory monitor before changing anything. Red means thrash; fine means a tool-call problem.
- If you’re thrashing, drop the model size first, the context length second, until the working set fits in RAM.
- Don’t buy a GPU to fix this yet. Tune what you own first. A GPU buys speed on work you may not even be doing.
The bottom line
- The 52-second tool call was never a verdict on local coding. It was an untuned setup on capable hardware.
- Keep the working set in RAM. That single rule explains all three knobs: smaller model, lighter quant, tighter context.
- A fast model that fits beats a smart model that swaps. For coding, that trade is almost always right.
Frequently Asked Questions
Why does a local tool call take 52 seconds?+
Almost always memory thrashing. The model plus its context didn't fit in RAM, so your machine is swapping to disk and waiting on I/O. Shrink the model or context until everything fits in RAM and the call drops to a few seconds.
Do I set the context window with a flag on ollama pull?+
No. There's no --quantize or context flag on pull. Quantization is part of the model tag, and context length is the OLLAMA_CONTEXT_LENGTH environment variable on the server.
Will a bigger model fix slow coding?+
Usually the opposite. A 7B that fits in RAM runs circles around a 14B that thrashes. For coding, a fast model that fits beats a smarter one that swaps to disk.