Keep OpenCode Under $1 a Day: Cost Dashboard
Build OpenCode token cost tracking that alerts at the $1/day line. The SQLite schema, the parser, the run-rate readout, and the four levers that cut spend.
>This is the money chapter. The opencode Stack ships the full operator stack: the 7-day cost log, the routing configs that feed this dashboard, and the per-seat team rollup a CFO will accept.
The opencode Stack
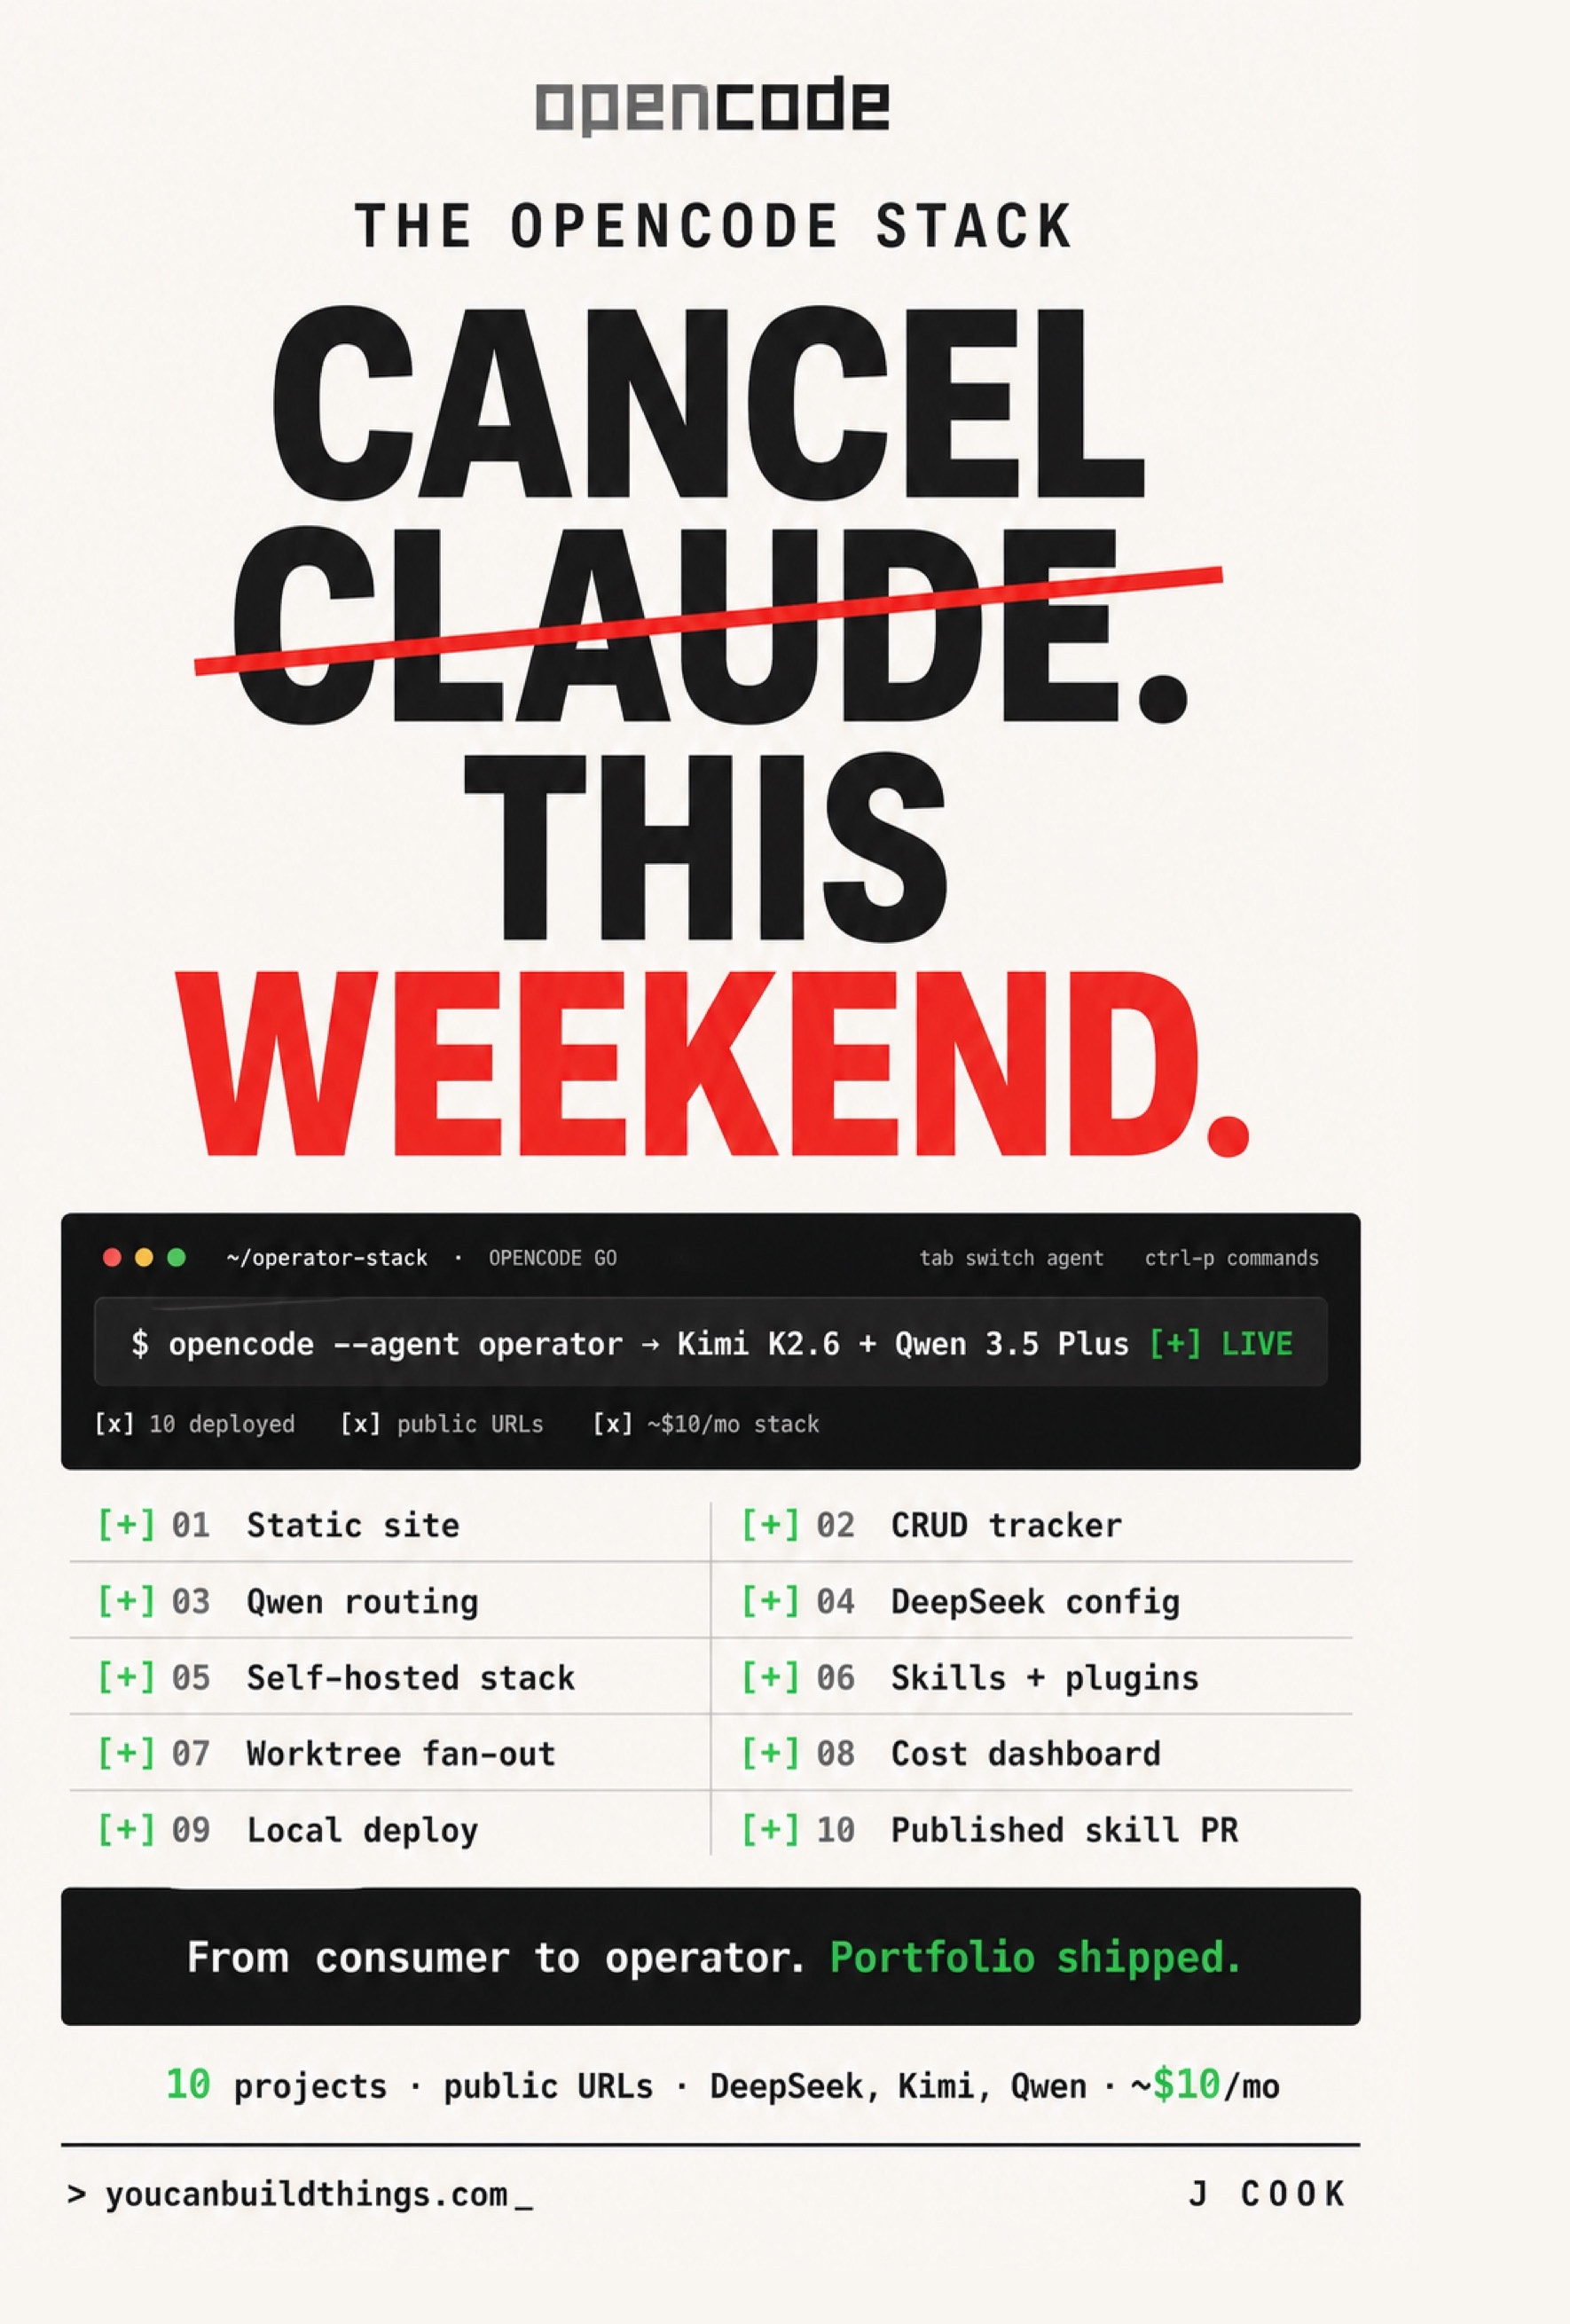
Cancel Claude This Weekend. Ship 10 Real Projects on $10/mo with DeepSeek, Kimi, and Qwen
Summary:
- Teaches OpenCode token cost tracking that enforces a $1/day ceiling instead of a sticky note.
- Uses OpenCode’s own session logs, a SQLite store, and a run-rate CLI.
- You leave with a dashboard that names which provider ate the most tokens, on which day.
- Bonus: the token-economics split and the four cost levers, in priority order.
OpenCode token cost tracking is the difference between “I think we’re under budget” and “we are under budget, here is the spreadsheet.” This is how to build the tracker that reads OpenCode’s own session data and yells at you before the day’s spend crosses a dollar, not after.
Where do my OpenCode tokens actually go?
They go to four categories, and output dominates. Input tokens are the prompt the model sees. Output tokens are the completion it produces. Cache-hit tokens are cheap repeats of a reused prefix. Overhead is tool-call serialization and retry logic. In a typical session the share lands at output 60-80%, input cache-miss 15-25%, input cache-hit 3-5%, overhead ~5%.
This question is common enough that someone built a dedicated tool for it. From r/opencodeCLI (265 upvotes):
“been using OpenCode for a while now and kept wondering where my tokens actually go. is it the coding? the debugging? or just me going back and forth with the model about nothing? so I built CodeBurn. it reads your opencode sqlite db locally and classifies every turn into task types based on tool usage. no LLM calls, fully deterministic. turns out exploration was my biggest cost at $35, not coding.”
That confirms the design: the data is already on disk in a local SQLite db, and classification by tool usage is enough. We are going to build a slightly stronger one because we also want alerting and a weekly report.
What does the dashboard need to read?
OpenCode session data lives at ~/.local/share/opencode/ (confirm with opencode debug paths). Each session entry from opencode stats carries the session ID, timestamps, provider, model, input/output/cache tokens, and cost. Store it in SQLite:
CREATE TABLE IF NOT EXISTS sessions (
  session_id TEXT PRIMARY KEY,
  started_at TEXT NOT NULL,
  ended_at TEXT NOT NULL,
  provider TEXT NOT NULL,
  model TEXT NOT NULL,
  input_tokens INTEGER NOT NULL,
  output_tokens INTEGER NOT NULL,
  cache_hit_tokens INTEGER DEFAULT 0,
  cost_usd REAL NOT NULL,
  iso_week TEXT NOT NULL,
  task_class TEXT
);
ISO week (2026-W19) is the grouping key because the weekly report aggregates by week and an ISO week never looks stale the way a calendar date does.
How do I parse the session logs?
A small poller tails the data directory and upserts rows. Copy-paste-ready skeleton:
import json, sqlite3
from pathlib import Path

DATA_DIR = Path.home() / ".local/share/opencode"
DB_PATH  = Path.home() / ".local/share/opencode-dashboard/cost.db"

def parse_session(session_file: Path) -> dict | None:
    """Return a row dict, or None if the session is still running."""
    try:
        data = json.loads(session_file.read_text())
        if "ended_at" not in data:
            return None
        u = data["usage"]
        return {
            "session_id": data["id"],
            "started_at": data["started_at"],
            "ended_at": data["ended_at"],
            "provider": data["provider"],
            "model": data["model"],
            "input_tokens": u["input_tokens"],
            "output_tokens": u["output_tokens"],
            "cache_hit_tokens": u.get("cache_hit_tokens", 0),
            "cost_usd": u["cost_usd"],
            "iso_week": data["started_at"][:8],
        }
    except (json.JSONDecodeError, KeyError):
        return None

def upsert(conn, row):
    conn.execute(
        "INSERT OR REPLACE INTO sessions VALUES "
        "(?,?,?,?,?,?,?,?,?,?,?)",
        (row["session_id"], row["started_at"], row["ended_at"],
         row["provider"], row["model"], row["input_tokens"],
         row["output_tokens"], row["cache_hit_tokens"],
         row["cost_usd"], row["iso_week"], None))
    conn.commit()
Verify the field names against your install once with opencode export <session_id> before trusting the parser; the session schema can shift release to release.
What does the readout look like?
One cost-dash today command, and you get the answer that justifies the whole build:
opencode cost dashboard | 2026-W19 Wednesday
─────────────────────────────────────────────
today's run-rate:    $0.62  (warning $0.80, cutoff $1.50)
session count:       11
top model:           opencode/kimi-k2.6   ($0.31, 50% of today)
top provider:        opencode/qwen3.5-plus ($0.18, 29% of today)
input/output split:  21% / 75% / 4% cache
this week so far:    $3.18  (target $7.00, on pace)
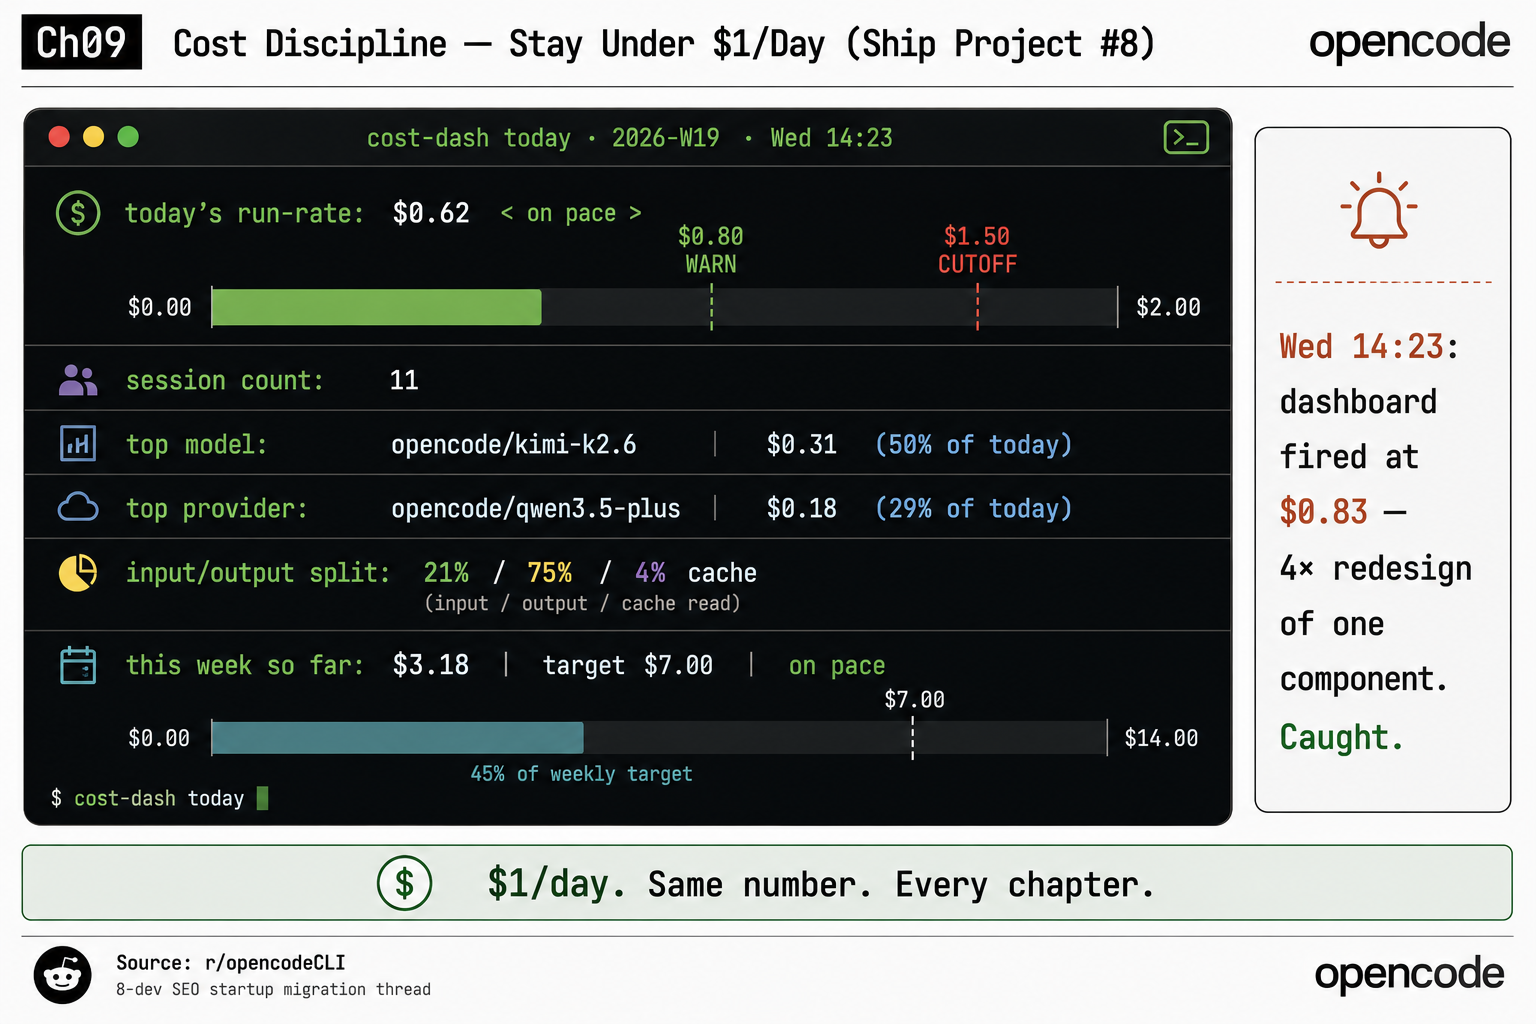
That is the real shape: run-rate $0.62, 11 sessions, top model opencode/kimi-k2.6 at $0.31 (50%), top provider opencode/qwen3.5-plus at $0.18 (29%), split 21% / 75% / 4%, week-to-date $3.18 against a $7.00 target (45% of the weekly target). The chart draws a warning band and a hard cutoff line above that ($1.50 warn, $2.00 cutoff on the weekly scale). One screen answers: which provider ate the most tokens, on which day.
What broke (the day the dashboard caught me)
The dashboard earned itself in week one. The cost log alone, summed Sunday night, would have shown a spike but not the cause. The dashboard showed the cause live. The verbatim entry from the build: “Wed 14:23: dashboard fired at $0.83, 4× redesign of one component. Caught.” The agent had re-run the same component four times because I did not like the variable naming, about twenty cents a round, and I was about to do it a fifth time when the alert popped. Without the real-time readout, “what did I work on Wednesday” is unreliable memory; with it, the bleed never became the week’s story.
Which lever do I pull when it fires?
Four levers, in priority order. The first two are 90% of cost discipline:
- Context discipline. Install skills so the agent loads summaries, not raw files, every turn. Add
.opencodeignorefor build artifacts and vendored deps. Biggest single lever for typical workloads. - Provider routing. Use the cheap fixer (Qwen 3.5 Plus, DeepSeek V4 Flash) for grunt edits; reserve the orchestrator (Kimi K2.6) for planning. If the dashboard shows orchestrator and fixer at equal token share, your routing is wrong.
- Session compaction.
/compactwhen a session crosses ~20 turns. Cleanup before the next task, not after. - Quota-aware switching. When the 5-hour cap hits 80%, rotate K2.6 to GLM-5 for the rest of the window. Manual, and that is fine.
Wire the alert as a cron job polling the SQLite store every five minutes. When today’s run-rate crosses the warning, fire a terminal bell or a Slack webhook:
*/5 * * * * cost-dash check --warn 0.80 --cutoff 1.50 || \
  curl -s -X POST "$SLACK_WEBHOOK" -d '{"text":"opencode > $0.80 today"}'
How does this scale to a team?
Per seat. Each developer’s ~/.local/share/opencode/ is independent, so each seat enforces its own $1/day and emits its own Sunday-night Markdown. The budget owner pulls the eight per-seat weekly reports Monday morning and sees who ran over and on what. The team math from the $10/mo plan (eight seats, ~$0.45/day average, ~$80/month) stops being an estimate and becomes a signed, dated spreadsheet.
What should you actually do?
- If you ship solo → build the SQLite store and
cost-dash today. Skip the daemon; eyeball the run-rate before you start a heavy session. - If you keep spiking → it is redesign loops or missing skills 90% of the time. Pull lever 1, then lever 2, before touching anything else.
- If you run a team → enforce per-seat, collect the weekly Markdown, and bring it to the budget conversation instead of a guess.
- If you just want the answer fast →
npx codeburnreads the same local db today; build the custom one when you need alerting and weekly rollups it does not do.
bottom_line
- A summed cost log tells you a spike happened. A live dashboard tells you why, while you can still stop it.
- Most savings come from two levers: cleaner context and correct routing. The other two are hygiene and pressure-release.
- $1/day is the warning line, not the target. On OpenCode Go a normal day costs about $0.45; the alert exists for the redesign-loop day, not the normal one.
Frequently Asked Questions
How do I track where my OpenCode tokens go?+
Parse OpenCode's session logs in ~/.local/share/opencode/ into a SQLite table keyed by provider, model, and ISO week, then run a CLI that prints today's run-rate, top model, top provider, and input/output split. The book builds this in about 150 lines of Python.
What is a realistic daily budget for OpenCode?+
The book's operational target is $1 a day per developer. On OpenCode Go at $10/mo a normal solo workload runs around $0.45/day, so $1/day has built-in headroom and is the warning line, not the floor.
Why does my OpenCode cost spike some days?+
Almost always one of three patterns: re-asking the model to redesign the same thing several times, no skills installed so the agent re-reads raw files every turn, or context-fill quality decay on a long session. A dashboard surfaces all three in real time.