Claude Code Subagents in Parallel: Are They Actually Faster?
I timed the same job with one Claude Code agent and with three subagents in parallel, same repo, same afternoon. The graph lost twice. Here is how to measure your own floor and get a verdict on your own work.
>This is the break-even calculator on one page. Claude Code In Parallel builds the metered graph it runs against, and eleven more systems on your own repo.
Hello builders,
Every multi agent vs single agent post I have read showed me the win: one Claude Code session grinding away for twenty minutes, four subagents finishing in ninety seconds, and a diagram with a great many arrows on it. I couldn’t tell from the outside whether any of that was real, so I put a stopwatch and a meter on the same job and ran it both ways: same repository, same model, same machine, same afternoon. The graph lost two races out of three, and the losses turned out to be worth more than the win.
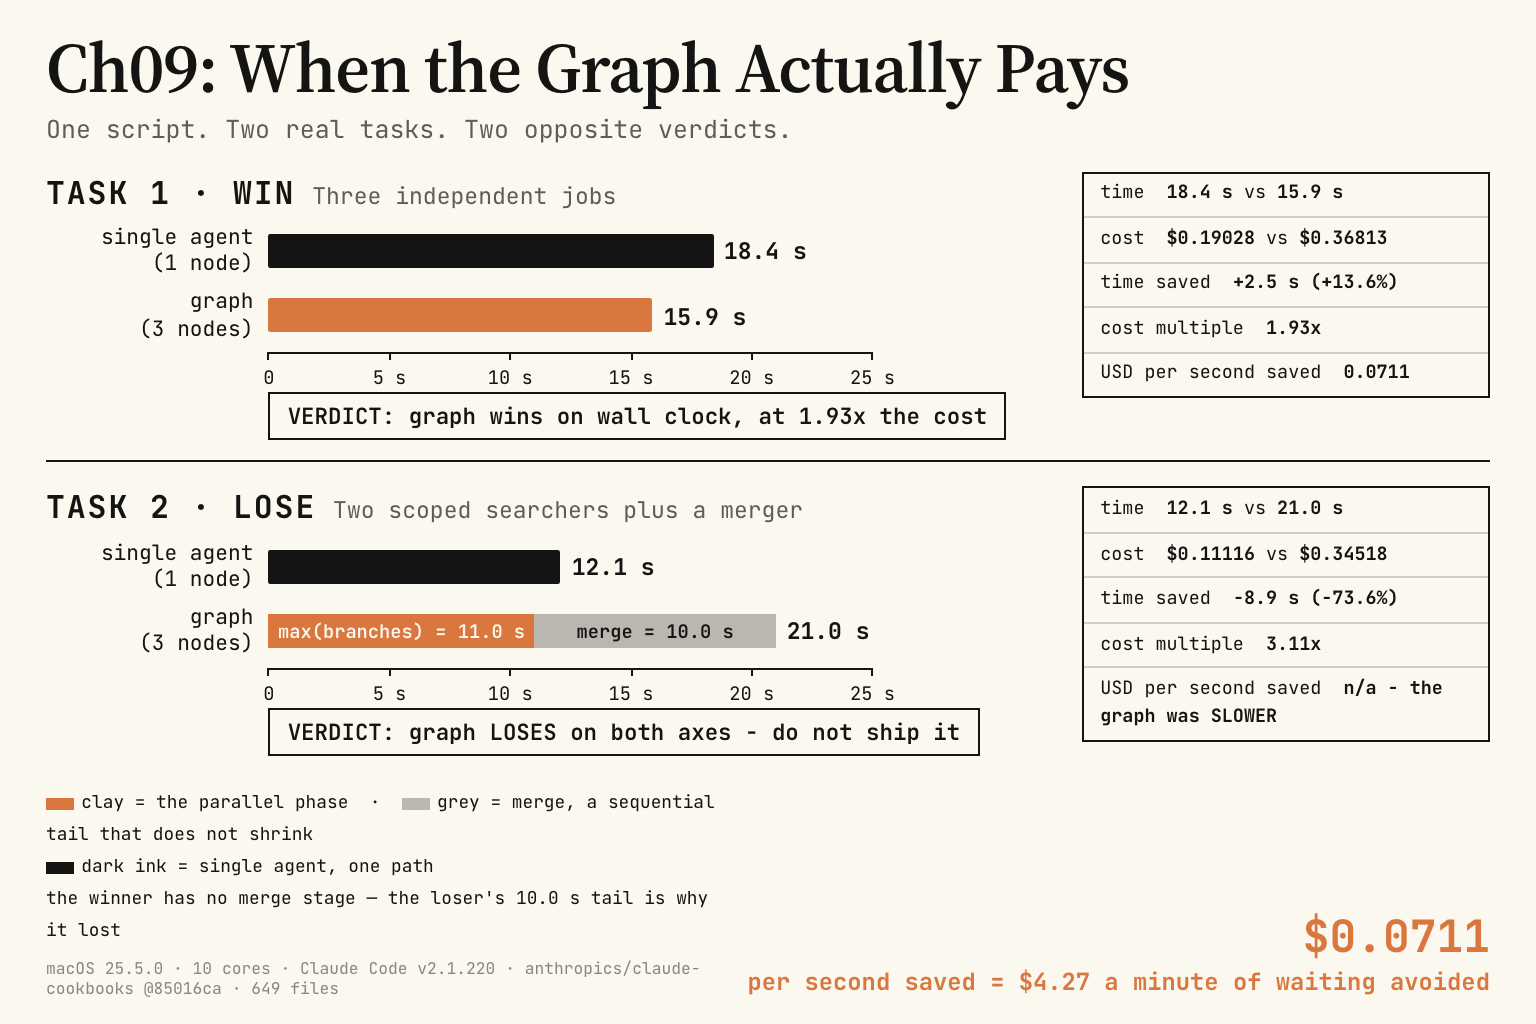
Here’s the rig, so we are working off the same numbers: macOS 25.5.0, ten cores, Claude Code v2.1.220, and anthropics/claude-cookbooks at commit 85016ca, a shallow clone of 649 files that is MIT licensed and yours in ten seconds. Every dollar below came out of total_cost_usd in the JSON envelope, and every wall clock came off time, from outside the process.
Task one was three genuinely independent jobs: read three notebooks, summarise each. One agent, in sequence, took 18.4 seconds and $0.19028. Three agents, one per notebook, all fired at once, took 15.9 seconds and $0.36813. That’s 2.5 seconds saved, or 13.6 percent, at 1.93 times the cost. The graph wins on wall clock, at 1.93x the cost, which is a real verdict and a thin one.
Task two was the version every tutorial demonstrates: two searchers, one directory each, and a merger. One agent came back in 12.1 seconds having spent $0.11116. The graph came back in 21.0 seconds having spent $0.34518, and returned a byte-identical list of seven file paths. 8.9 seconds slower, 73.6 percent worse, at 3.11 times the cost. The graph loses on both axes and I would not ship it.
If I had not been running a stopwatch I would have shipped it anyway and told you it was faster, because it felt faster. Two agents starting inside the same second feels like something happening.
Before going further, here is the strongest number on the other side, published by the people who sell the agents. Anthropic measured their own research system against a single agent on their internal eval:
a multi-agent system with Claude Opus 4 as the lead agent and Claude Sonnet 4 subagents outperformed single-agent Claude Opus 4 by 90.2% on our internal research eval
That is a real result and I am not going to argue with it. Read the next two sentences from the same team, though:
In our data, agents typically use about 4× more tokens than chat interactions, and multi-agent systems use about 15× more tokens than chats.
most coding tasks involve fewer truly parallelizable tasks than research, and LLM agents are not yet great at coordinating and delegating to other agents in real time
Ninety percent better, at fifteen times the tokens, on research. That last clause is the one that decides it for the rest of us, because most of what we point these things at is not research. It is code, and code has fewer pieces that genuinely come apart than a literature search does. (Anthropic Engineering, “How we built our multi-agent research system”)
The two numbers that decide it
Once we can see both of them, the whole thing stops being mysterious.
Every node pays a fixed floor to exist. In an empty directory, on a brand new git repo, with no CLAUDE.md and nothing to read, the cheapest model answering the smallest possible question bills $0.0177873 and about 3.1 seconds. That is 25,655 tokens, of which fifty-one are the work. The rest is the system prompt, the tool definitions, the environment description: the scaffolding an agent needs before it can be an agent. We do not control most of it and we pay all of it, once per node.
Wall clock for a parallel phase is max(branch), not sum(branch). Three branches of 10, 12 and 15 seconds finish in 15, not 37.
Put those two together and the arithmetic falls out. For n branches each taking b seconds, sequential is roughly n × b and parallel is roughly b + floor, so parallel wins when:
b > floor / (n − 1)Do not use my 3.1 seconds. That number is my machine, my model, my CLAUDE.md and my tool count, and yours will differ. Measure your own before the formula means anything:
cd $(mktemp -d) && git init -q
claude -p --output-format json --model haiku "Reply with exactly: OK" </dev/null \
  | jq '{floor_seconds: (.duration_api_ms/1000), floor_usd: .total_cost_usd}'
Four seconds of work, and it is the one constant here that has to be yours and not mine. Plug your number in. With my 3.1 seconds and three branches, a branch has to run longer than 1.6 seconds to be worth splitting; with ten branches, longer than 0.34 seconds. Which sounds like parallel always wins.
Why the formula was wrong
Run task two through it. Three nodes, floor 3.1 seconds, break-even branch length 1.6 seconds, and my branches ran seven to eleven seconds. The formula says parallel should have won comfortably. It lost by nine.
Look at the second bar in the chart and we can see where it went. The two searchers ran at once and finished in 11.0 seconds. Then the merge node started, cold, paid its own floor, and took another 10.0 seconds. max(branches) + merge is 21, which is exactly what the stopwatch said.
So the formula quietly assumed the fan-out was the whole graph. It isn’t, and that’s the part that costs people real money: a fan-out with a merge stage has a sequential tail, and the tail does not shrink when you add branches. Ten searchers instead of two finish in about the same wall clock as two, and then wait for the same merge.
The useful version of the rule has two halves. Parallelism helps the fan-out. Nothing helps the tail except making it smaller, and we make it smaller by doing more work inside the branches so the merge has less to reason about.
One warning while you measure, because this one cost me an afternoon. Don’t take the wall clock from the JSON envelope. On one parallel run the envelope reported duration_ms of 6,273 and duration_api_ms of 334,941. I had a stopwatch on it from outside the process: 335.3 seconds. One of those fields is off by a factor of fifty-three, and it is not the one with the boring name. My first version of the break-even script computed the graph’s wall clock as max(duration_api_ms) across all the envelopes, and it confidently printed PARALLEL WINS on the run the stopwatch says lost by nine seconds. It was averaging the merge node in as though it ran alongside the searchers. Cost comes from the envelopes. Time comes from time.
The bill only goes one way
Here is the part those charts hide. There’s no crossover on cost. There is no point at which a graph becomes cheaper, because n nodes always pay n floors to do the work one node did while paying one. Task one cost 1.93 times more. Task two cost 3.11 times more. Neither of those numbers was ever going below 1.
So we are not looking for the point where a graph gets cheap. We’re looking for the point where the time it buys is worth what it costs, and my winning case put that at $0.0711 per second saved, which works out to $4.27 a minute of waiting avoided. Whether that is a good trade is not a technical question and I can’t answer it for you. You can now answer it in one sentence at a standup, which is more than anybody arguing about this online can do.
And the largest cost is not on either axis. Task one saved 2.5 seconds a run. Against that, my first graph took an afternoon to build and considerably longer to stop breaking. The bugs, in the order they cost me time:
- The word split.
for d in $DIRSturned three multi-word concerns into ten single words and spawned ten searchers instead of three. Nothing errored. It cost roughly double and returned 73 findings of which 21 were duplicates. - The trap.
trap 'kill 0' EXIT INT TERMmade every successful run exit 144, becausekill 0on the way out kills the shell on its way out. - The orphan. Killing the orchestrator did not kill its children, so a node from the dead run was still writing to a file the resumed run was about to write to.
- The judge with no brief. It was told to keep the paths matching “the brief” and was never told what the brief was.
Ten hours of that, against 2.5 seconds a run at seven cents a second, is repaid somewhere in the tens of thousands of runs, at any rate we would accept.
Which reads like an argument against the whole technique, and it isn’t, for one reason: most of these graphs are not built to save seconds. They’re built because a single agent cannot hold the work, or because nothing was checking the output, or because we needed to explain a routing decision three weeks later. Somebody put the limit better than I can, in a post that picked up 44,000 views:
a graph buys breadth, not judgment. Five agents will find more than one, but they will not reason better than one.
Breadth is purchasable. Judgement is not, and confusing the two is how people end up paying for a team where one agent would have done. And if somebody shows you a fan-out and calls it faster with no stopwatch anywhere in the demo, they did not time it either.
So run your own task both ways before committing to either. Time it from outside the process, read total_cost_usd off the envelopes, and divide the difference. Then ask the question the calculator can’t: would I still build this if it were exactly as fast and exactly as expensive as one agent? If the answer is yes, we have a real reason and the seconds are a bonus. If it is no, and the number says the graph loses, we have our afternoon back.
Just be honest about which one you bought. Don’t tell your team it’s faster when there’s a scorecard in the repository saying it is 73.6 percent slower.
Now go build something this weekend!
John Cook