Monte Carlo Backtesting: Is Your Trading Edge Real?
Monte Carlo backtesting trading strategies in Python: 1,000 simulations plus an in-sample/out-of-sample split for one go/no-go verdict before going live.
>This covers the backtest gate. Use Claude to Build an AI Trading Bot goes deeper on the screener that generates the trades and the risk module that sizes them.

Use Claude to Build an AI Trading Bot One Weekend
Turn $500 into $10K in 90 Days with Stocks, Options, and Prediction Markets
Summary:
- Resample your bot’s trade log 1,000 times into equity curves and read the 5th percentile.
- Run an in-sample vs out-of-sample split first. It catches overfitting the Monte Carlo alone hides.
- The output is one of four verdicts: EDGE CONFIRMED, OVERFIT, NO EDGE, or INSUFFICIENT DATA.
- Copy-paste Python: the simulation, the split gate, and the rule of thumb that combines them.
Monte Carlo backtesting trading strategies is how you find out whether your bot has a real edge or a three-week hot streak. My screener ran for three weeks. Twelve of sixteen trades green. A 75% win rate. I was picking furniture for the new apartment.
Then I backtested it properly. The 75% dropped to 52% over six months of history. The first run was a bull-market fluke. Going live with $10,000 on that would have been a very expensive lesson in sample size.
Why does a single backtest lie to you?
A single backtest tells you what happened in one specific sequence of trades. Markets went up these days, down those days, your strategy made this much. But the order was luck. What if the big winner that carried your quarter had landed during a drawdown instead? What if three losers had clustered?
Monte Carlo simulation answers that by shuffling the deck. Take every trade return, reorder it at random, simulate the equity curve. Do it a thousand times. You get a distribution instead of a single story.
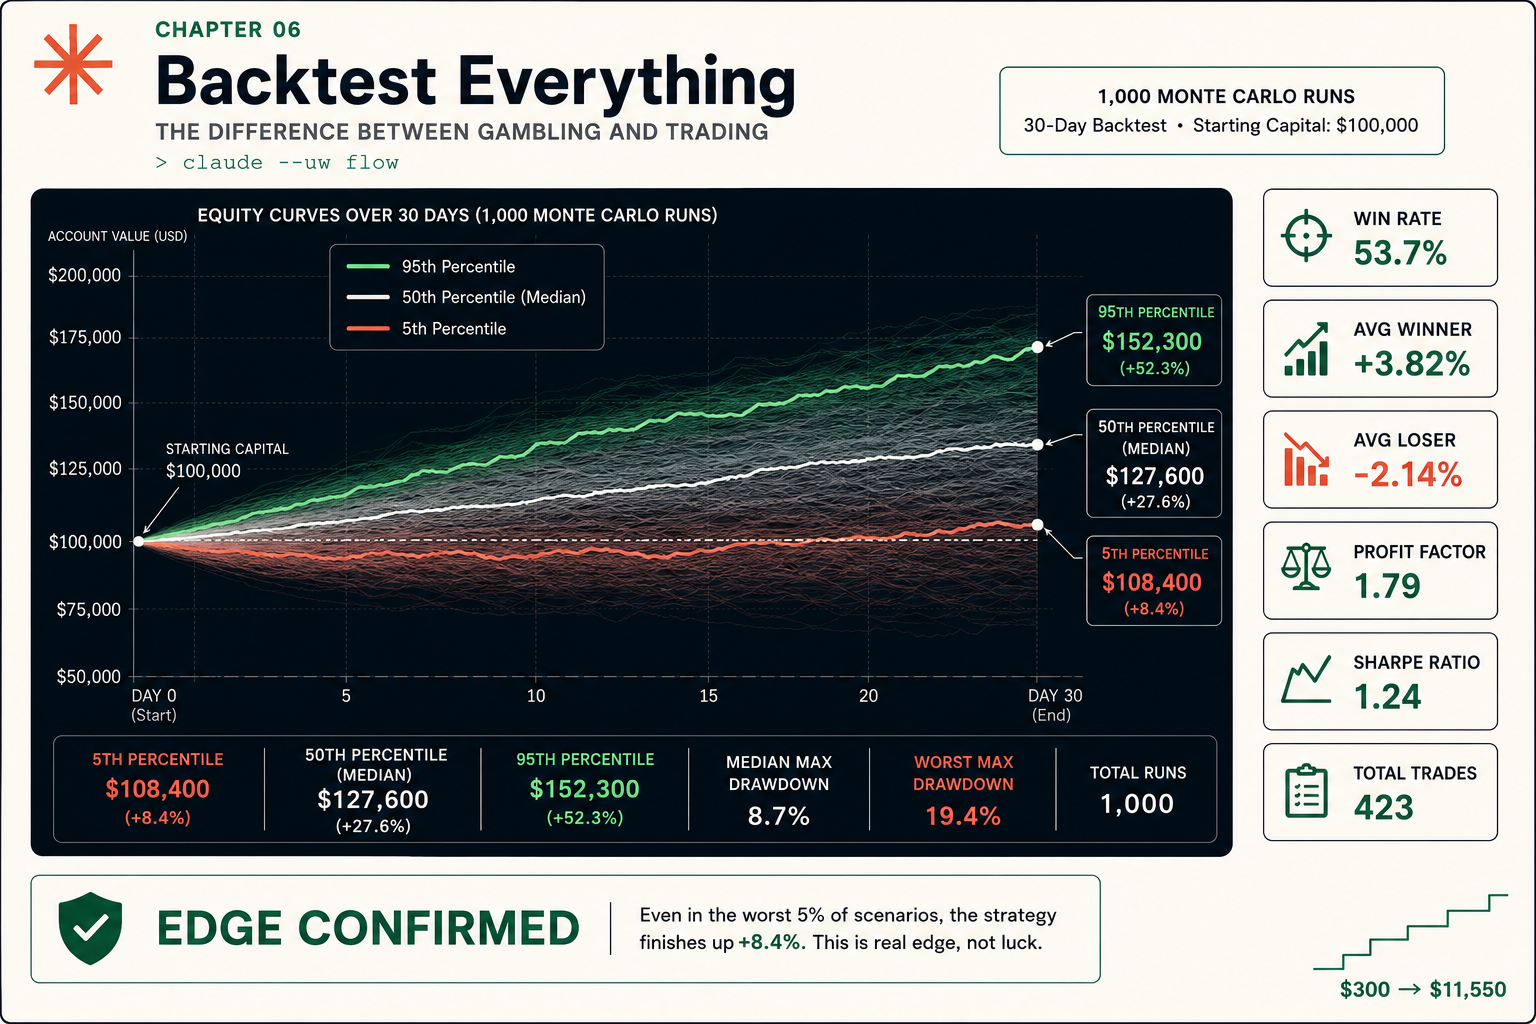
A real run on a $100,000 account, 423 trades, 1,000 simulations, looks like this:
WIN RATE        53.7%      5TH PERCENTILE   $108,400  (+8.4%)
AVG WINNER      +3.82%     50TH PERCENTILE  $127,600  (+27.6%)
AVG LOSER       -2.14%     95TH PERCENTILE  $152,300  (+52.3%)
PROFIT FACTOR   1.79       MEDIAN MAX DD    8.7%
SHARPE RATIO    1.24       WORST MAX DD     19.4%
TOTAL TRADES    423        VERDICT          EDGE CONFIRMED
The number that decides everything is the 5th percentile: $108,400, up 8.4%. Even in the worst 5% of trade orderings, this strategy still finishes up. That is an edge. If the 5th percentile were below $100,000, the strategy could lose money depending purely on trade order. That is a coin flip wearing a system’s clothes.
How do you run the simulation?
You resample the returns with replacement and rebuild the curve, a thousand times:
import random, numpy as np

def monte_carlo(trades, n=1000, capital=100_000, position_pct=0.02):
    returns = [t["return"] for t in trades]
    finals, drawdowns = [], []
    for _ in range(n):
        shuffled = random.sample(returns, len(returns))
        eq, peak, max_dd = capital, capital, 0.0
        for r in shuffled:
            eq += (eq * position_pct) * r
            peak = max(peak, eq)
            max_dd = max(max_dd, (peak - eq) / peak)
        finals.append(eq)
        drawdowns.append(max_dd)
    return {
        "p5":  np.percentile(finals, 5),
        "p50": np.percentile(finals, 50),
        "p95": np.percentile(finals, 95),
        "worst_dd": max(drawdowns),
    }
That is the whole engine. 2% position sizing per trade, track the peak, track the worst drawdown. The fan chart is just these curves plotted on top of each other.
What broke
Monte Carlo alone fooled me. My first screener had seven parameters: volume/OI threshold, min premium, a max premium ceiling, a days-to-expiration range, a time-of-day filter, and a sector exclusion list. Tuned, it backtested at a 67% win rate and a 2.3 Sharpe. The Monte Carlo 5th percentile was comfortably positive. Beautiful.
Then I ran it on data it had never seen. Win rate 44%. Sharpe 0.2. It lost money. Seven parameters gave me seven ways to fit noise: the premium ceiling happened to exclude a cluster of training losers, the morning-only filter dodged one rough afternoon, the sector list dropped two sectors that had a bad training week.
A developer on r/algotrading put the same lesson plainly:
Overfitting. Took me a while to understand what this even meant. … Not using a healthy slippage and fees calculation. This mostly came up when trading anything daily or more frequently. I rarely delve into trading anything more frequently than weekly these days.
Source: r/algotrading, “Backtests lie, live trading doesn’t” (top comment by u/axehind).
The fix: run an in-sample vs out-of-sample split before Monte Carlo, and let it veto the verdict.
def in_out_split(trades, gap_pp=5.0, sharpe_drop=0.5):
    s = sorted(trades, key=lambda t: t["date"])
    mid = len(s) // 2
    a, b = s[:mid], s[mid:]
    if len(s) < 30:
        return {"overfit": None, "note": "fewer than 30 trades"}
    win = lambda x: sum(r["return"] > 0 for r in x) / len(x)
    in_w, out_w = win(a), win(b)
    in_s, out_s = sharpe(a), sharpe(b)        # annualized Sharpe helper
    gap = abs(in_w - out_w) * 100
    overfit = gap > gap_pp or (in_s - out_s) > sharpe_drop
    return {"in_w": in_w, "out_w": out_w, "gap_pp": gap, "overfit": overfit}
What are the four verdicts?
The split plus the Monte Carlo produce exactly four outcomes. Read which picture you are looking at:
- EDGE CONFIRMED. In-sample win rate 54.5%, out-of-sample 52.8%. Gap 1.7pp (under 5). Sharpe drop 0.13 (under 0.5). Monte Carlo 5th percentile positive (+4.2%). The halves agree and luck-adjusted you still profit. This is the only verdict that supports going live.
- OVERFIT. In-sample 61%, out-of-sample 47%. Gap 14pp. Sharpe collapses 1.85 to 0.95, a 0.90 drop. The Monte Carlo 5th percentile can still look positive because it averages both regimes. Does not matter. The halves disagree. Disqualified. Strip parameters and re-test.
- NO EDGE. In-sample 50.1%, out-of-sample 49.6%. Consistent, no overfit flag, but the Monte Carlo 5th percentile is negative (-2.8%). Consistency without profitability is not an edge. The strategy loses across many futures.
- INSUFFICIENT DATA. 14 in-sample trades, 12 out-of-sample. Below the 30-trade minimum. Stats are not meaningful and the split cannot tell you anything. The fix is more data, never more parameter tuning.
The rule of thumb that ties it together: in/out within 5 percentage points AND Monte Carlo 5th percentile above starting capital AND Sharpe drop under 0.5 equals EDGE CONFIRMED. Anything else is the backtest saving you money.
def verdict(split, mc, capital=100_000):
    if split.get("overfit") is None:        return "INSUFFICIENT DATA"
    if split["overfit"]:                    return "OVERFIT"
    if mc["p5"] > capital:                  return "EDGE CONFIRMED"
    return "NO EDGE"
What should you actually do?
- If the verdict is OVERFIT → drop parameters until the in/out gap closes. My seven-parameter screener became a three-parameter screener and went from 67%/44% to 53%/51%. Less impressive on history. Profitable live.
- If the verdict is NO EDGE → raise the premium filter or tighten signal quality, then re-run. Do not lower the simulation count to 100 so the numbers look nicer. The market will find the bad ordering with your real dollars.
- If the verdict is INSUFFICIENT DATA → widen the date window and add tickers until you clear 30 valid trades. More data beats more tuning, every time.
- If the verdict is EDGE CONFIRMED → look at the worst-case max drawdown (19.4% in the run above). Could you stomach $100K dropping to $80,600 before recovering? If not, cut position size before you cut the ribbon.
bottom_line
- One backtest is a single story. Monte Carlo turns it into a distribution, and the 5th percentile is the only number that matters.
- The in/out split runs first and has veto power. A positive Monte Carlo on overfit parameters is a trap, not a green light.
- Fewer parameters survive live. If removing a knob barely changes the backtest, remove it for good.
Frequently Asked Questions
How many Monte Carlo simulations should I run for a trading strategy?+
1,000 runs gives you stable percentile estimates. Going to 10,000 barely moves the 5th percentile but takes 10x longer. 1,000 is the practical sweet spot.
What does the 5th percentile mean in a Monte Carlo backtest?+
It is your portfolio value in a bad scenario, worse than 95% of simulated trade orderings. If it stays above starting capital, the strategy makes money even when luck runs against you.
How do I know if my backtest is overfit?+
Split the trades in half chronologically. If the out-of-sample win rate is more than 5 points worse, or Sharpe drops more than 0.5, it is overfit. Disqualify it regardless of the Monte Carlo numbers.