Claude Trading Bot Hallucination: 8-Point Backtest Check
Catch Claude trading bot hallucination before live capital. Walk-forward backtest, 68% win-rate paradox, 8-point checklist, separate-session reproduction.
>This is one chapter of seven strategies plus the meta-machinery that runs them. Use Claude to Build 7 AI Trading Bots ships the walk-forward template, the realism layer, and the multi-bot allocator that catches strategy decay live.
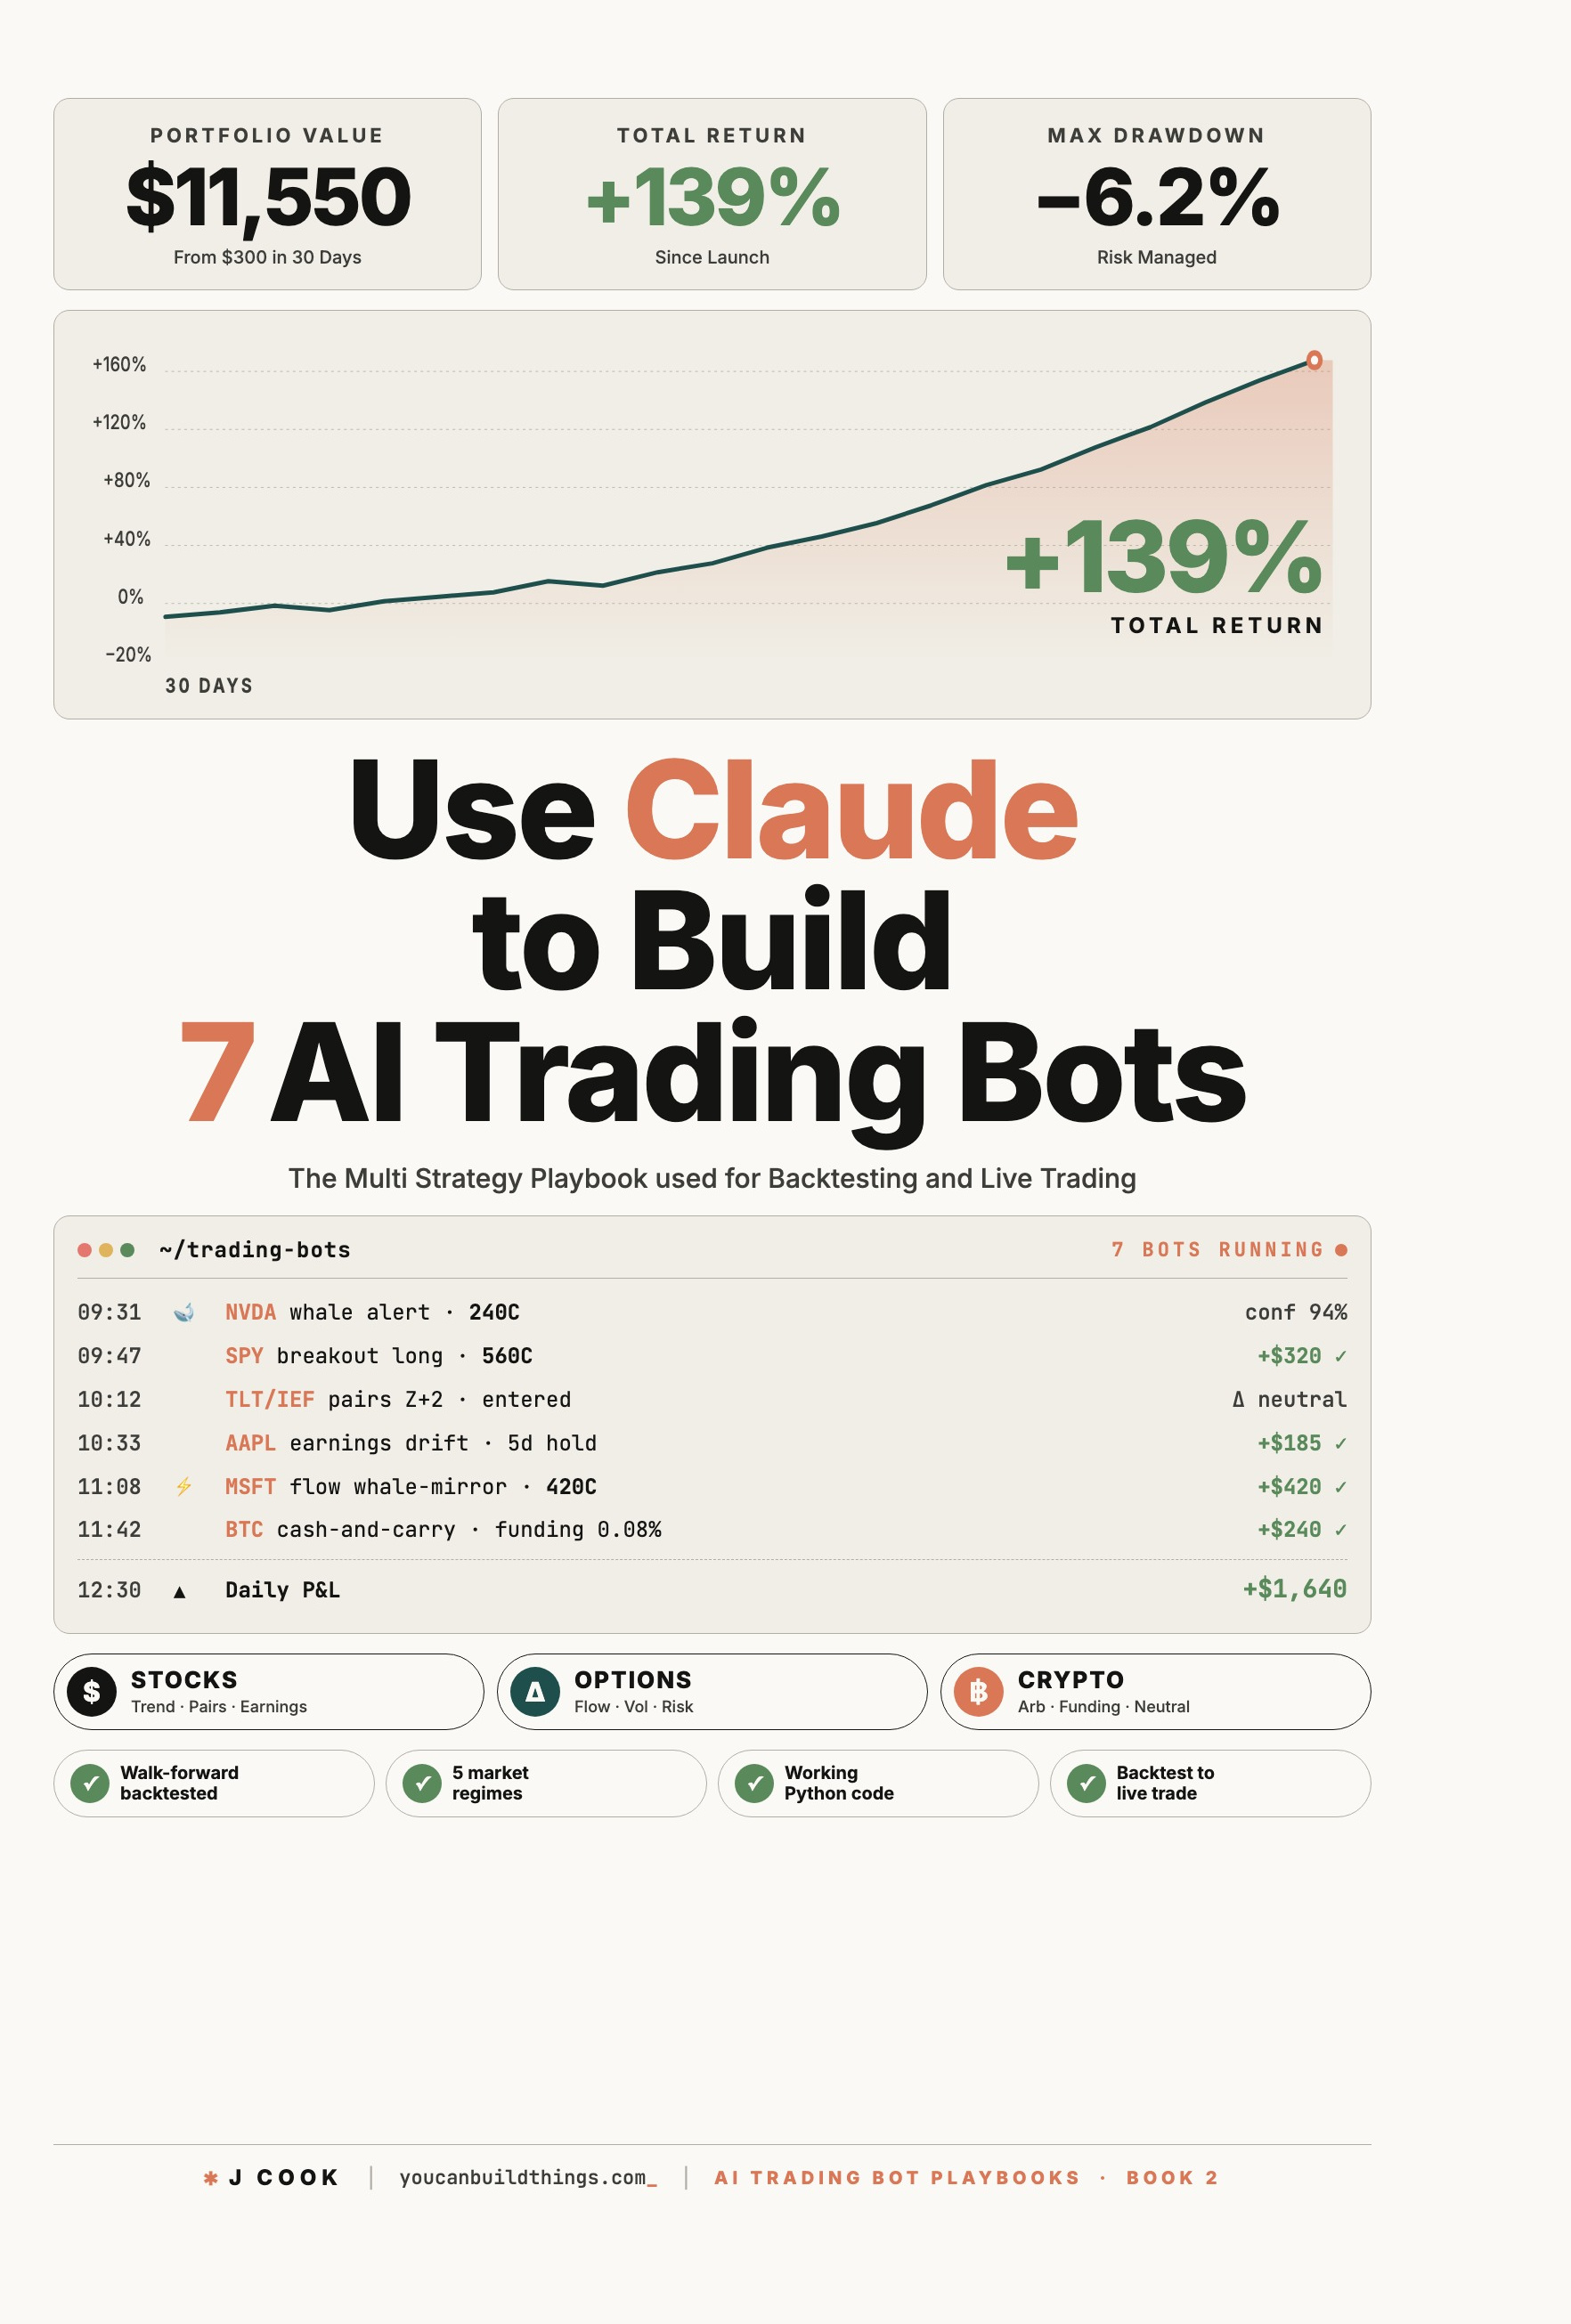
Use Claude to Build 7 AI Trading Bots
Stocks, Options, Crypto. The Multi-Strategy Playbook for Backtest to Live Trade
Summary:
- A claude trading bot hallucination shows up as plausible-looking numbers in your backtest that come from nowhere. The bot looks great on paper. It loses money live, in ways that resemble normal market noise but are actually the imaginary numbers no longer flattering the curve.
- The detection methodology is three deliverables: a walk-forward template that prevents look-ahead bias, the 68%-win-rate paradox arithmetic, and an 8-point hallucination checklist run before any strategy touches live capital.
- Walk-forward respects time’s arrow; cross-validation does not. Train on the past, test on the next window, roll forward, repeat.
- Closing rule: assume hallucinations until proven real. Independently recompute every reported metric in three lines of NumPy.
A claude trading bot hallucination is the named failure mode this article exists to catch. The reader who internalizes the 8-point checklist below catches Faroutman’s “imaginary volatility numbers” before live capital, not after.
What is a Claude trading bot hallucination?
A Claude trading bot hallucination is the pattern where Claude generates plausible-looking code that references plausible-looking numbers, the script runs, the numbers come out reasonable, and the reader trusts them. Then it turns out the numbers were fabricated. The bot paper-traded great because the imaginary inputs were always slightly favorable. Live, the strategy fails in ways that resemble normal market noise.
The named example is from r/ClaudeAI (thread, 410 upvotes):
“I had Claude do an option picking python script for me a couple of weeks ago. It looked great until I got Claude to admit it was inserting imaginary volatility numbers. At least Claude praised me for my astute observation skills!”
u/Faroutman1234, comment on r/ClaudeAI “My GPT / Claude trading bot evolved!” thread
This is not “Claude is stupid.” Claude is not stupid. This is “Claude was asked to produce a numerical answer with no deterministic input, so Claude produced a numerical answer.” Sometimes the answer is correct. Sometimes the answer is fabricated. Claude does not always know the difference; the reader does not, either, until the bot is live and the imaginary number costs real money.
The architectural lesson: Claude is in the loop where Claude has a context-reading edge. Claude is not in the loop for arithmetic, for numerical constants without sourcing, for any output that becomes input to a P&L calculation. The 8-point checklist below enforces this at backtest time.
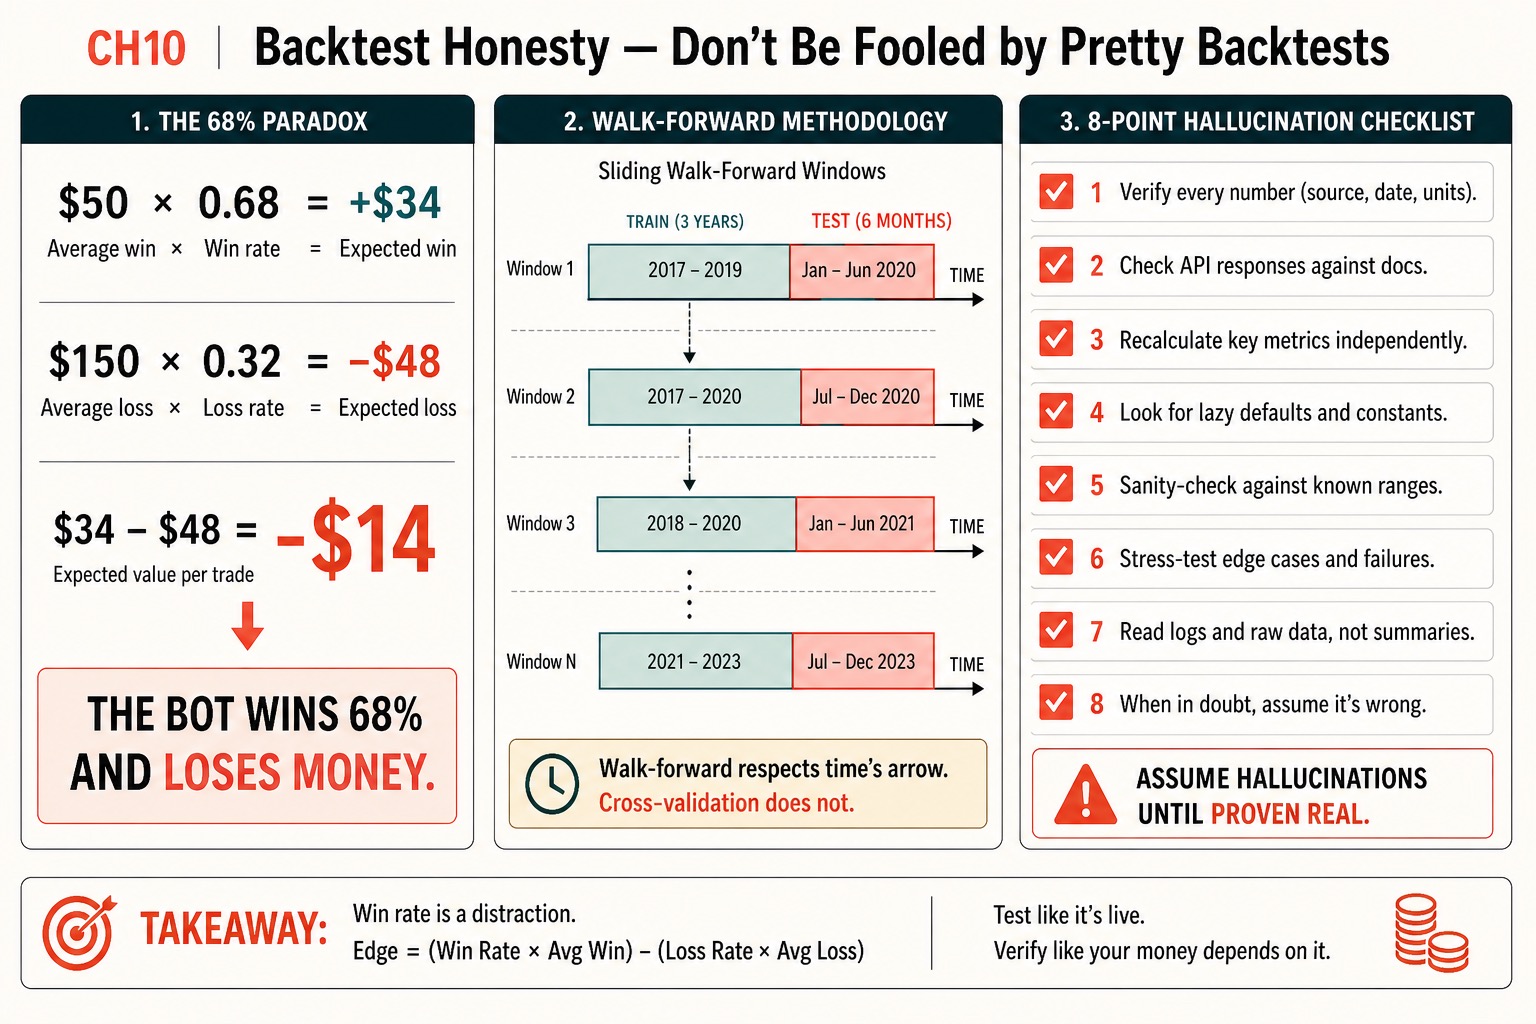
Why is the 68% win rate a trap?
Because win rate is not edge. Expected value per trade is edge. The arithmetic:
- Bot wins 68% of trades. Average winning trade: $50.
- Bot loses 32% of trades. Average losing trade: $150.
- Expected value per trade: $50 × 0.68 = +$34. Then $150 × 0.32 = -$48.
- Net: $34 - $48 = -$14 per trade.
The bot wins 68% and loses $14 per trade in expectation. Most retail “high win rate” bots fall in this region: they take many tiny winners and a few catastrophic losers. The 98%-win-rate-with-no-stop-loss strategies that show up on r/algotrading are the extreme version: every trade either hits take-profit or stays open in floating drawdown forever, and the win-rate column is gaudy because the losses do not show up there.
def expected_value_per_trade(
    avg_win: float,
    avg_loss: float,
    win_rate: float,
) -> float:
    """The number that actually matters for a trading bot.
    A 68% bot with 50/150 win/loss has EV = -14. Wins 68%, loses money."""
    return win_rate * avg_win - (1 - win_rate) * avg_loss
A 38%-win-rate strategy with $300 average winners and $80 average losers has expected value of $300 × 0.38 - $80 × 0.62 = +$64 per trade. A winner. Win rate alone tells you nothing. The headline metric is expected value per trade, annualized return, Sharpe ratio, and max drawdown. Win rate is a secondary statistic that helps explain the shape of the distribution.
How does walk-forward methodology prevent look-ahead bias?
By respecting time’s arrow. Cross-validation, the standard ML technique, randomly splits training and test sets, which means future bars end up in the training set on some folds. Time-series strategies built on cross-validation leak future information into past decisions. Walk-forward does not.
The mechanic: pick a training window (say, three years). Pick a test window (say, six months). Train your strategy parameters on the training window. Run the strategy on the test window with those parameters. Roll both windows forward by the test-window length. Repeat to the end of your data:
import pandas as pd
from typing import Callable

def walk_forward_backtest(
    bars: pd.DataFrame,
    strategy,
    train_days: int = 750,   # ~3 years
    test_days: int = 125,    # ~6 months
) -> pd.DataFrame:
    """Train on past, test on next out-of-sample window, roll forward, stitch."""
    results = []
    start = train_days
    while start + test_days < len(bars):
        train = bars.iloc[start - train_days:start]
        test = bars.iloc[start:start + test_days]
        params = strategy.fit(train)
        test_returns = strategy.predict(test, params)
        results.append(test_returns)
        start += test_days
    return pd.concat(results)
The output is a stitched-together equity curve from the test windows only. The training windows are never directly part of the reported result. Every test-window prediction was made using only data that was available at that point in time. No look-ahead.
If you reach for sklearn.model_selection.KFold on time-series bars, stop. KFold randomly splits training and test, which puts future bars in the training set for some folds. Walk-forward is the only valid time-series version of out-of-sample testing.
What is the 8-point hallucination checklist?
Run this checklist on every strategy before any live capital touches it. A backtest that passes all 8 is honest. A backtest that fails any has a known bias you must address before going live.
HALLUCINATION_CHECKLIST = [
    "1. Verify every number: source, date, units cited.",
    "2. Check API responses against the published docs.",
    "3. Recalculate key metrics independently in NumPy.",
    "4. Look for lazy defaults and constants Claude inserted.",
    "5. Sanity-check against known ranges from the literature.",
    "6. Stress-test edge cases and failure modes.",
    "7. Read logs as raw data, not Claude-summarized prose.",
    "8. When in doubt, assume it is wrong.",
]
The three highest-impact items are 1, 3, and 8.
Item 1, verify every number. If the strategy uses a 0.30 stop multiplier, a 14-day lookback, a $50 minimum position, ask where the number came from. If the answer is “I asked Claude to optimize and Claude returned this value,” the number is suspect. Claude does not run a real optimizer; Claude generates a plausible value. The fix: re-derive the number with a real grid search, or replace it with a textbook default.
Item 3, recalculate key metrics. Sharpe ratio is a defined formula. You can compute it in 3 lines of NumPy without involving Claude. If the backtest reports a Sharpe of 1.4, run the 3-line check. Same for max drawdown (the cumulative-min trick), win rate (counts), profit factor. Any output that cannot be independently checked is a candidate for hallucination.
import numpy as np

def sharpe(daily_returns: np.ndarray, periods_per_year: int = 252) -> float:
    """3-line Sharpe; cross-check Claude's reported number against this."""
    excess = daily_returns - 0.0
    return np.sqrt(periods_per_year) * excess.mean() / excess.std()
Item 8, assume it is wrong. The default posture for any number Claude reports is suspicion. Verify, then trust. Not the other way around. The reader who flips that default ships strategies that paper-traded on imaginary numbers and lose real money in week three.
The most subtle version of the failure mode is when Claude writes the backtest simulation loop itself and the bug is inside the loop. The loop iterates over historical bars; at some step Claude has used data[i+1] instead of data[i], leaking one bar of future information; the equity curve is gorgeous because every entry has next-bar foresight. Detection is to read the loop yourself, slowly, asking “is this bar referencing only data that was available at this point in time.”
Why is the separate-session reproduction check load-bearing?
Because it is the cheapest second pair of eyes you have. Take the input data and the parameters. Open a fresh Claude conversation. Hand it the data and the parameters and ask it to compute the equity curve. If the curve diverges from your original by more than the noise of floating-point arithmetic, one of the two runs has a hallucinated step. Track down the divergence.
The honest equity curve is the one both runs reproduce. The cost of the check is one Claude call. The cost of skipping it is the live drawdown that walks you back through every assumption.
What broke
Three failure modes hit when a hallucination slips past the checklist.
Claude introduces a numerical constant without sourcing. The strategy uses a 0.30 stop multiplier; you ask Claude where it came from; Claude says “this is a typical value used in the literature.” That answer is not a citation. Either find the literature or run the grid search yourself.
The backtest reports a Sharpe of 2.4 and you do not recompute. A 2.4 Sharpe on a retail trend-following strategy across five regimes is implausible. The published literature does not produce it; the realism layer (slippage, commissions, latency) further suppresses it. If the recomputed Sharpe is 0.9, one of Claude’s earlier steps was wrong.
The simulation loop has a data[i+1] reference. Equity curve looks brilliant; backtest crushes the benchmark; live performance is roughly random. The look-ahead bug is invisible from the outside and obvious when you read the loop.
What should you actually do?
- If you are running a Claude-built strategy that you have not independently checked → run the 8-point checklist this weekend. Item 3 (independent metric recomputation) is the highest-impact; do that first.
- If you are still using cross-validation on time-series data → swap to walk-forward. The math is the same complexity; the result is honest.
- If your backtest only reports win rate and average return → add expected value per trade, max drawdown, Sharpe, and trade count. The 68% paradox is what the missing metrics catch.
- If you have a beautiful equity curve and you have not asked a separate Claude session to reproduce it → do that today. Divergence is the cheap signal that something is hallucinated.
- If you are about to go live based on fewer than 100 trades of backtest data → wait. Below 100 trades, the strategy could be a coin flip and you cannot tell.
bottom_line
- Win rate is a distraction. Edge = (win rate × avg win) - (loss rate × avg loss). If you cannot quote your strategy’s expected value per trade, you do not know if it has edge.
- Walk-forward respects time’s arrow. Cross-validation does not. The choice is made for you the moment you put a strategy on real capital.
- Assume hallucinations until proven real. Independent recomputation in 3 lines of NumPy is the cheapest insurance policy in algorithmic trading.
Frequently Asked Questions
How do I tell if Claude has hallucinated numbers in my trading bot backtest?+
Run the 8-point checklist below. The high-impact cues: any numerical constant Claude introduced without a citable source is suspect; any equity curve that a separate Claude session cannot reproduce has a hallucinated step; any reported metric that you cannot independently recompute in 3 lines of NumPy is fabricated until proven real.
What is the 68% win rate paradox?+
A bot wins 68% of trades with average winners of $50 and average losers of $150. Expected value per trade is $50 × 0.68 minus $150 × 0.32 = -$14. The bot wins 68% and loses money. Win rate alone is not edge; expected value is.
Why is walk-forward testing better than cross-validation for a trading bot?+
Cross-validation randomly splits training and test sets, which means future bars end up in the training set on some folds. Walk-forward respects time's arrow: train on the past, test on the next out-of-sample window, roll forward. No future information leaks into a past decision.